Technical Analysis of CPAI 2024-05-10
Overview:
In analyzing the Technical Analysis (TA) data for CPAI over the last 5 days, we will delve into the trend, momentum, volatility, and volume indicators to provide a comprehensive outlook on the possible stock price movement in the coming days. By examining key metrics such as moving averages, MACD, RSI, Bollinger Bands, and OBV, we aim to offer valuable insights and predictions for potential price action.
Trend Indicators Analysis:
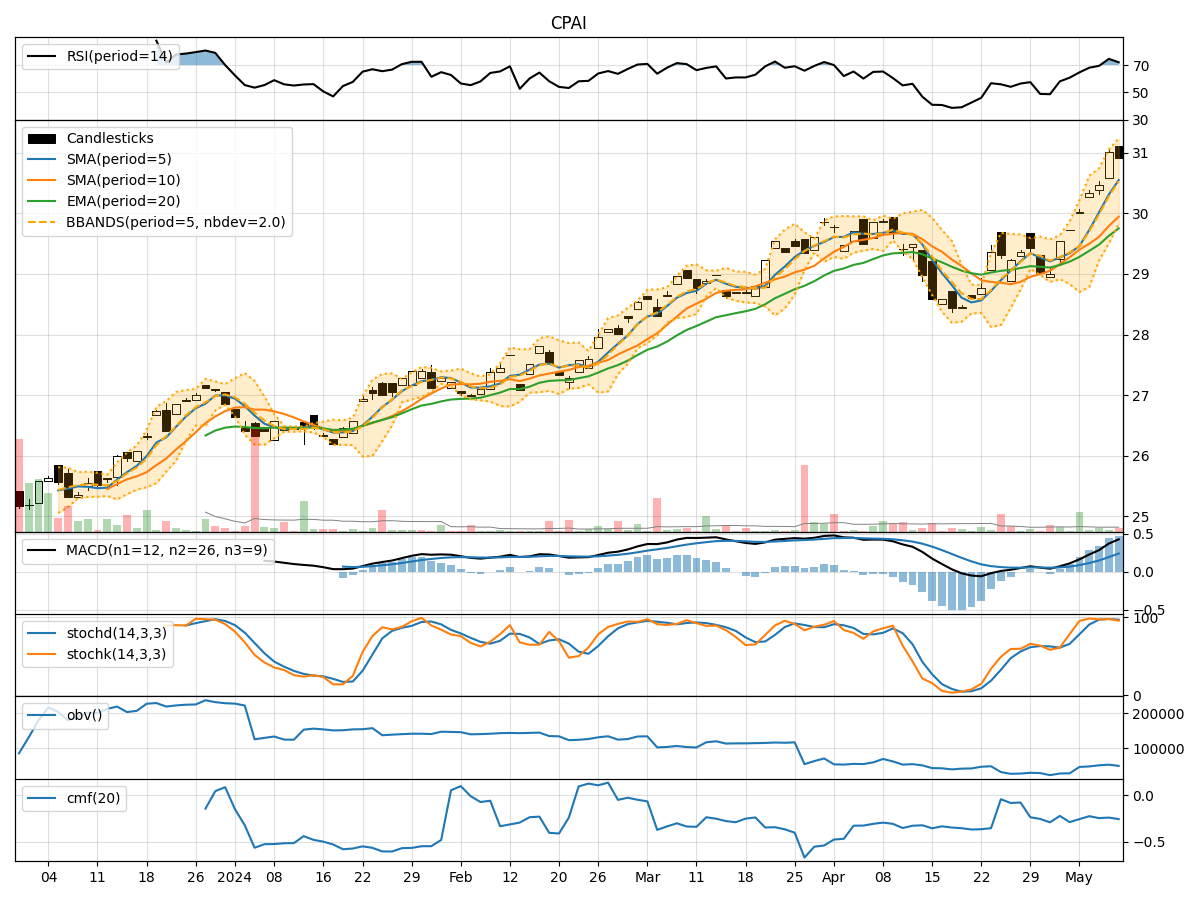
- Moving Averages (MA): The 5-day MA has been consistently trending upwards, indicating a bullish momentum in the short term.
- MACD: The MACD line has been above the signal line, suggesting a positive trend in price momentum.
- MACD Histogram: The histogram has been increasing, signifying strengthening bullish momentum.
Momentum Indicators Analysis:
- RSI: The RSI has been in the overbought territory, indicating a strong bullish sentiment.
- Stochastic Oscillator: Both %K and %D have been at high levels, suggesting an overbought condition.
- Williams %R: The indicator has been in the oversold region, potentially signaling a reversal.
Volatility Indicators Analysis:
- Bollinger Bands: The stock price has been trading near the upper Bollinger Band, indicating high volatility and a potential overbought condition.
- Bollinger Band Width: The band width has been relatively wide, suggesting increased price volatility.
- Bollinger Band %B: The %B indicator has been above 0.8, indicating a potential overbought situation.
Volume Indicators Analysis:
- On-Balance Volume (OBV): The OBV has been declining, indicating a divergence between price and volume, which could signal a potential trend reversal.
- Chaikin Money Flow (CMF): The CMF has been negative, suggesting selling pressure in the stock.
Key Observations and Opinions:
- Trend: The stock is in a strong bullish trend based on moving averages and MACD.
- Momentum: Momentum indicators suggest an overbought condition, which could lead to a potential pullback.
- Volatility: High volatility near the upper Bollinger Band indicates a possible reversal or consolidation.
- Volume: Declining OBV and negative CMF signal caution despite the bullish trend.
Conclusion:
Based on the analysis of the technical indicators, the stock price of CPAI is likely to experience a short-term pullback or consolidation due to the overbought momentum, high volatility, and divergence in volume indicators. Traders should exercise caution and consider taking profits or implementing risk management strategies in anticipation of a potential downward correction.