Technical Analysis of CQQQ 2024-05-10
Overview:
In the last 5 trading days, CQQQ has shown mixed signals across various technical indicators. The stock price has fluctuated within a certain range, indicating indecision in the market. We will analyze the trend, momentum, volatility, and volume indicators to determine the possible future stock price movement.
Trend Indicators:
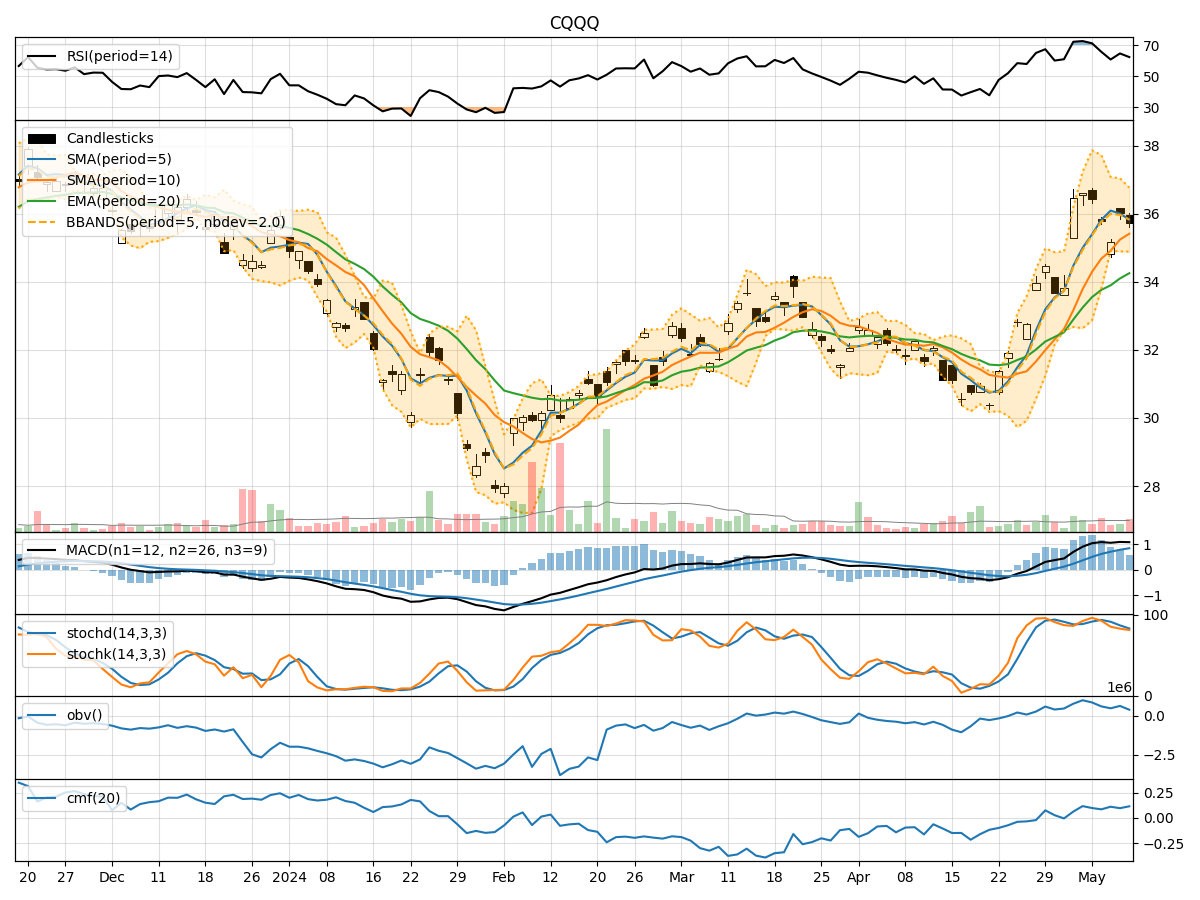
- Moving Averages (MA): The 5-day MA has been fluctuating around the stock price, indicating short-term volatility. The SMA(10) and EMA(20) have shown a slight upward trend, suggesting a potential bullish momentum.
- MACD: The MACD line has been above the signal line, indicating a bullish trend. The MACD histogram has been positive, supporting the bullish momentum.
Momentum Indicators:
- RSI: The RSI has been fluctuating in the overbought territory, suggesting a potential reversal or consolidation.
- Stochastic Oscillator: Both %K and %D have been in the overbought zone, indicating a potential bearish divergence.
- Williams %R: The Williams %R has been fluctuating in the oversold territory, indicating a potential reversal.
Volatility Indicators:
- Bollinger Bands: The stock price has been trading within the bands, suggesting a period of consolidation. The bands have not shown any significant expansion or contraction.
- Bollinger %B: The %B indicator has been hovering around the midline, indicating a balanced market sentiment.
Volume Indicators:
- On-Balance Volume (OBV): The OBV has shown mixed signals, indicating indecision among investors.
- Chaikin Money Flow (CMF): The CMF has been positive, suggesting buying pressure in the market.
Key Observations:
- The trend indicators suggest a potential bullish momentum in the short term.
- Momentum indicators show conflicting signals, with RSI indicating a potential reversal and Stochastic Oscillator signaling overbought conditions.
- Volatility indicators point towards a period of consolidation with no clear trend direction.
- Volume indicators reflect mixed signals, indicating uncertainty among market participants.
Conclusion:
Based on the analysis of technical indicators, the next few days' possible stock price movement for CQQQ is likely to be sideways with a slight bullish bias. Traders should exercise caution and closely monitor key support and resistance levels for potential breakout or breakdown scenarios. It is advisable to wait for more clarity in the market before taking significant trading positions.