Technical Analysis of CRDT 2024-05-10
Overview:
In analyzing the technical indicators for CRDT over the last 5 days, we will delve into the trend, momentum, volatility, and volume indicators to provide a comprehensive outlook on the possible stock price movement in the coming days.
Trend Indicators:
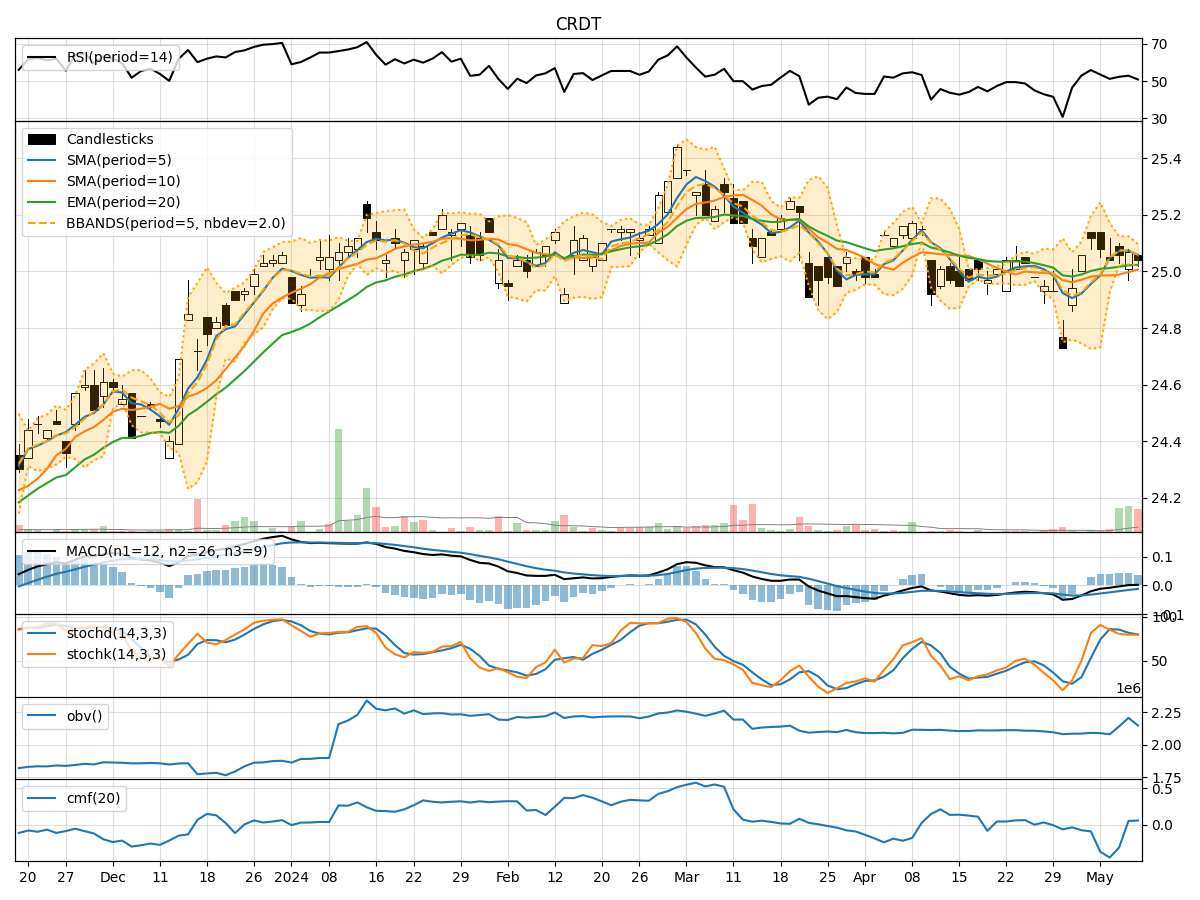
- Moving Averages (MA): The 5-day Moving Average has been relatively stable around the closing prices, indicating a consistent trend.
- MACD: The Moving Average Convergence Divergence shows a positive trend with the MACD line consistently above the signal line.
- EMA: The Exponential Moving Average has been slightly increasing, suggesting a bullish sentiment in the short term.
Momentum Indicators:
- RSI: The Relative Strength Index has been fluctuating around the neutral zone, indicating a balanced momentum.
- Stochastic Oscillator: Both %K and %D have been hovering around the overbought territory, suggesting a potential reversal or consolidation.
- Williams %R: The Williams %R is in the oversold region, indicating a possible buying opportunity.
Volatility Indicators:
- Bollinger Bands: The Bollinger Bands have been narrowing, indicating decreasing volatility and a potential breakout in the near future.
- Bollinger %B: The %B indicator is currently below 0.5, suggesting a possible oversold condition.
Volume Indicators:
- On-Balance Volume (OBV): The OBV has shown mixed signals, with some days experiencing selling pressure and others showing accumulation.
- Chaikin Money Flow (CMF): The CMF has been negative, indicating distribution, but the recent uptick suggests a potential shift towards accumulation.
Key Observations and Opinions:
- Trend: The trend indicators suggest a bullish sentiment in the short term, supported by the positive MACD and EMA trends.
- Momentum: The momentum indicators show a mixed picture, with RSI and Stochastic Oscillator signaling potential reversals or consolidation.
- Volatility: The narrowing Bollinger Bands indicate a period of low volatility, potentially preceding a significant price movement.
- Volume: The volume indicators reflect mixed market participation, with OBV showing selling pressure and CMF hinting at a shift towards accumulation.
Conclusion:
Based on the analysis of the technical indicators, the next few days' possible stock price movement for CRDT is likely to be sideways with a slight bullish bias. Traders should monitor the narrowing Bollinger Bands for a potential breakout, while also keeping an eye on the Stochastic Oscillator for any reversal signals. Overall, a cautious approach with a focus on risk management is advisable in the current market environment.