Technical Analysis of CRED 2024-05-10
Overview:
In analyzing the technical indicators for CRED over the last 5 days, we will delve into the trend, momentum, volatility, and volume indicators to provide a comprehensive outlook on the possible stock price movement. By examining these key aspects, we aim to offer valuable insights and predictions for the upcoming days.
Trend Indicators:
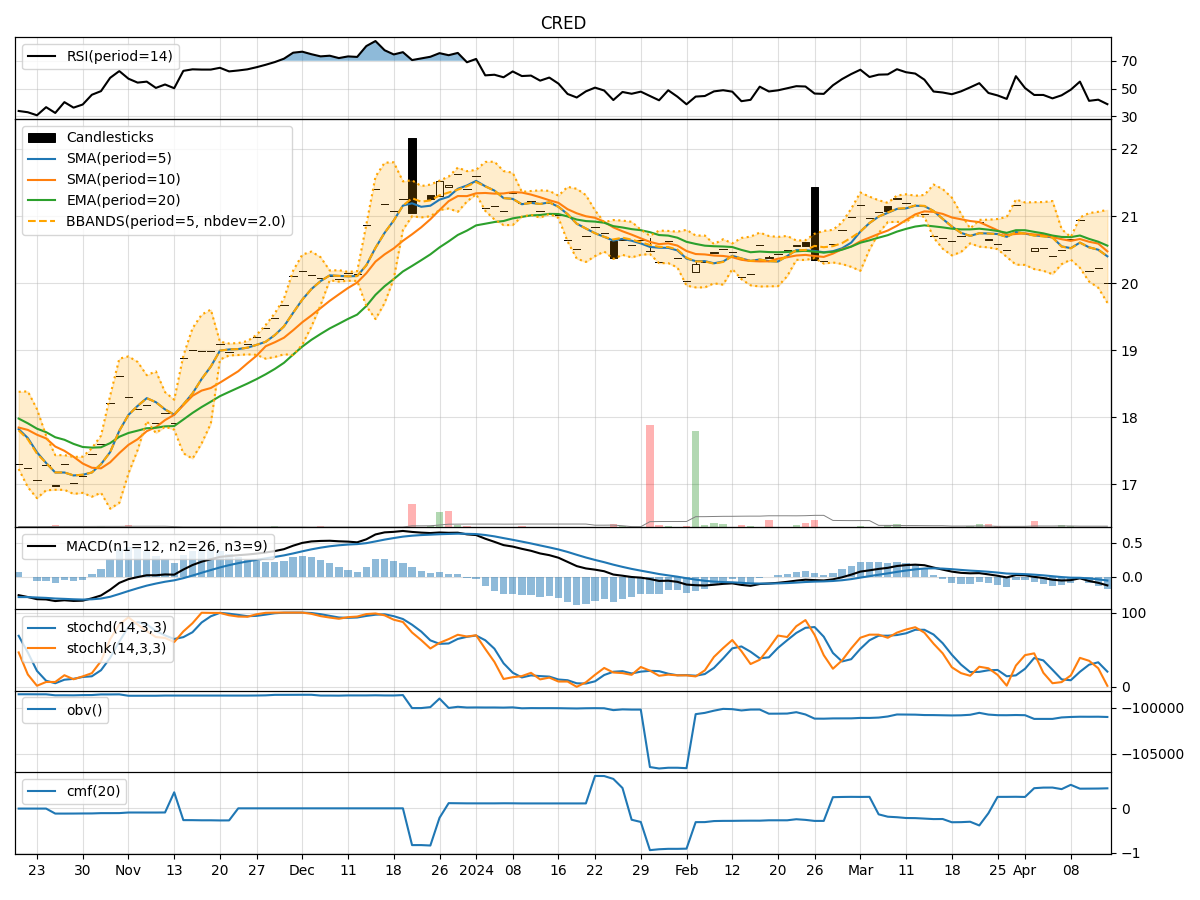
- Moving Averages (MA): The 5-day MA has been consistently above the closing prices, indicating a short-term uptrend.
- MACD: The MACD line has been negative but showing signs of convergence towards the signal line, suggesting a potential reversal.
- RSI: The RSI has been fluctuating around the neutral zone, reflecting indecision in the market sentiment.
Momentum Indicators:
- Stochastic Oscillator: The stochastic indicators have been hovering in the overbought territory, signaling a potential reversal or consolidation.
- Williams %R: The Williams %R has been oscillating near oversold levels, indicating a possible buying opportunity.
Volatility Indicators:
- Bollinger Bands (BB): The Bollinger Bands have been narrowing, suggesting a decrease in volatility and a potential breakout in the near future.
Volume Indicators:
- On-Balance Volume (OBV): The OBV has been fluctuating, indicating mixed buying and selling pressure.
- Chaikin Money Flow (CMF): The CMF has been declining, suggesting a decrease in buying pressure.
Key Observations:
- The trend indicators show a mixed picture with a slight bullish bias in the short term.
- Momentum indicators indicate a potential reversal or consolidation phase.
- Volatility indicators suggest a possible breakout due to decreasing volatility.
- Volume indicators reflect mixed buying and selling pressure with a declining buying momentum.
Conclusion:
Based on the analysis of the technical indicators, the next few days' possible stock price movement for CRED is likely to experience consolidation with a slight upward bias. Traders should watch for a potential breakout as volatility decreases, and monitor the stochastic indicators for a possible reversal. It is advisable to exercise caution and wait for clearer signals before making significant trading decisions.