Technical Analysis of CRIT 2024-05-10
Overview:
In analyzing the technical indicators for CRIT stock over the last 5 days, we will delve into the trend, momentum, volatility, and volume indicators to provide a comprehensive outlook on the possible future stock price movement. By examining these key indicators, we aim to offer valuable insights and recommendations for potential investors.
Trend Analysis:
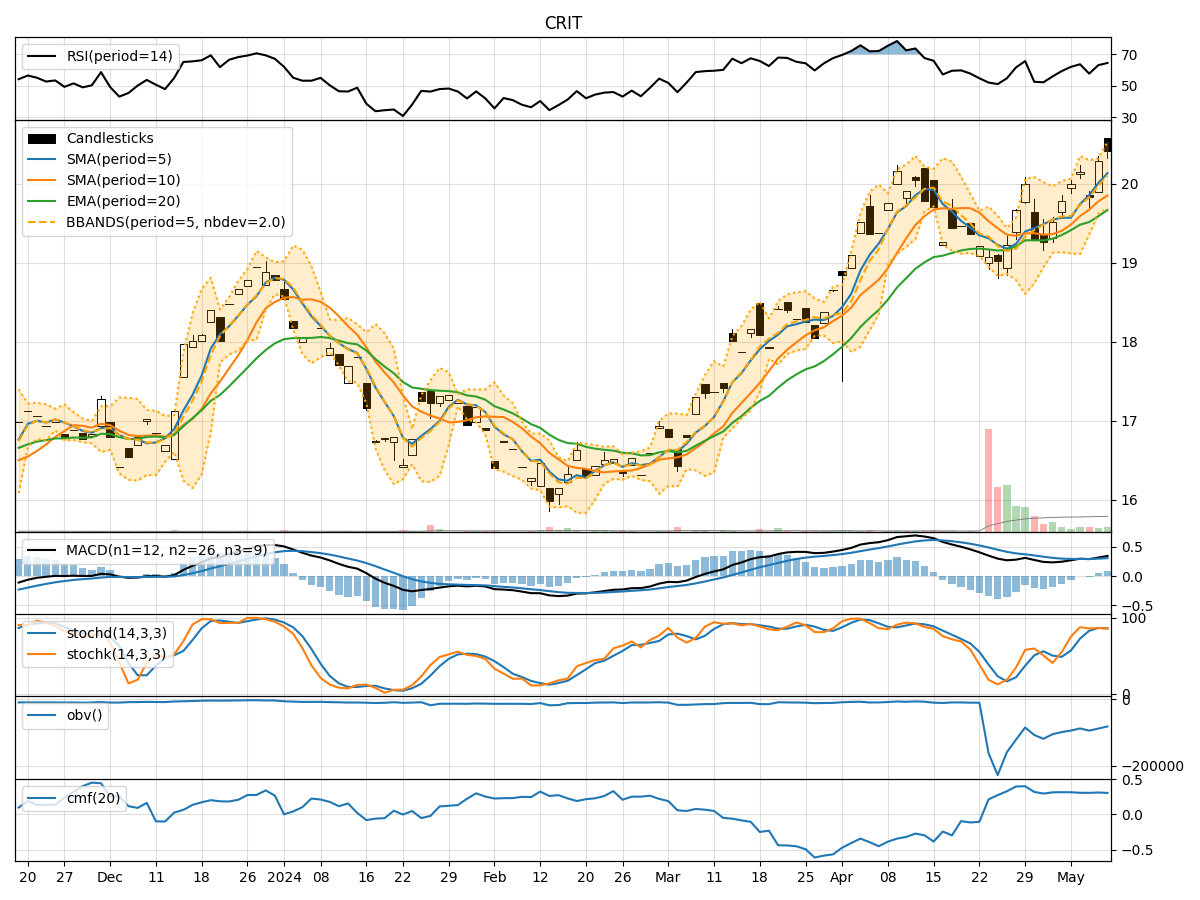
- Moving Averages (MA): The 5-day Moving Average (MA) has been consistently above the Simple Moving Average (SMA) and Exponential Moving Average (EMA), indicating a bullish trend.
- MACD: The MACD line has been consistently above the signal line, with both lines showing an upward trend, suggesting bullish momentum.
- RSI: The Relative Strength Index (RSI) has been fluctuating in the overbought territory, indicating strong buying pressure.
Momentum Analysis:
- Stochastic Oscillator: Both %K and %D lines of the Stochastic Oscillator have been in the overbought zone, suggesting a potential reversal or consolidation.
- Williams %R: The Williams %R indicator has been hovering in the oversold territory, indicating a potential buying opportunity.
Volatility Analysis:
- Bollinger Bands (BB): The stock price has been trading within the upper Bollinger Band, indicating high volatility and a potential overbought condition.
- Bollinger Band Width: The Bollinger Band Width has been relatively narrow, suggesting a period of consolidation or a potential breakout.
Volume Analysis:
- On-Balance Volume (OBV): The OBV has been fluctuating, indicating mixed buying and selling pressure.
- Chaikin Money Flow (CMF): The CMF has been positive, suggesting a net inflow of money into the stock.
Key Observations:
- The trend indicators suggest a strong bullish sentiment in the short term.
- Momentum indicators show signs of potential overbought conditions, indicating a possible reversal or consolidation.
- Volatility indicators point towards high volatility and a potential period of consolidation.
- Volume indicators reflect mixed buying and selling pressure, with a slight positive bias.
Conclusion:
Based on the analysis of the technical indicators, the next few days' possible stock price movement for CRIT is likely to be sideways to slightly bullish with a potential for consolidation. Traders should closely monitor the momentum indicators for any signs of a reversal or continuation of the bullish trend. Additionally, keeping an eye on the volatility and volume indicators can provide insights into potential breakout opportunities. Overall, a cautious approach with proper risk management is recommended in the current market environment.