Technical Analysis of CRTC 2024-05-10
Overview:
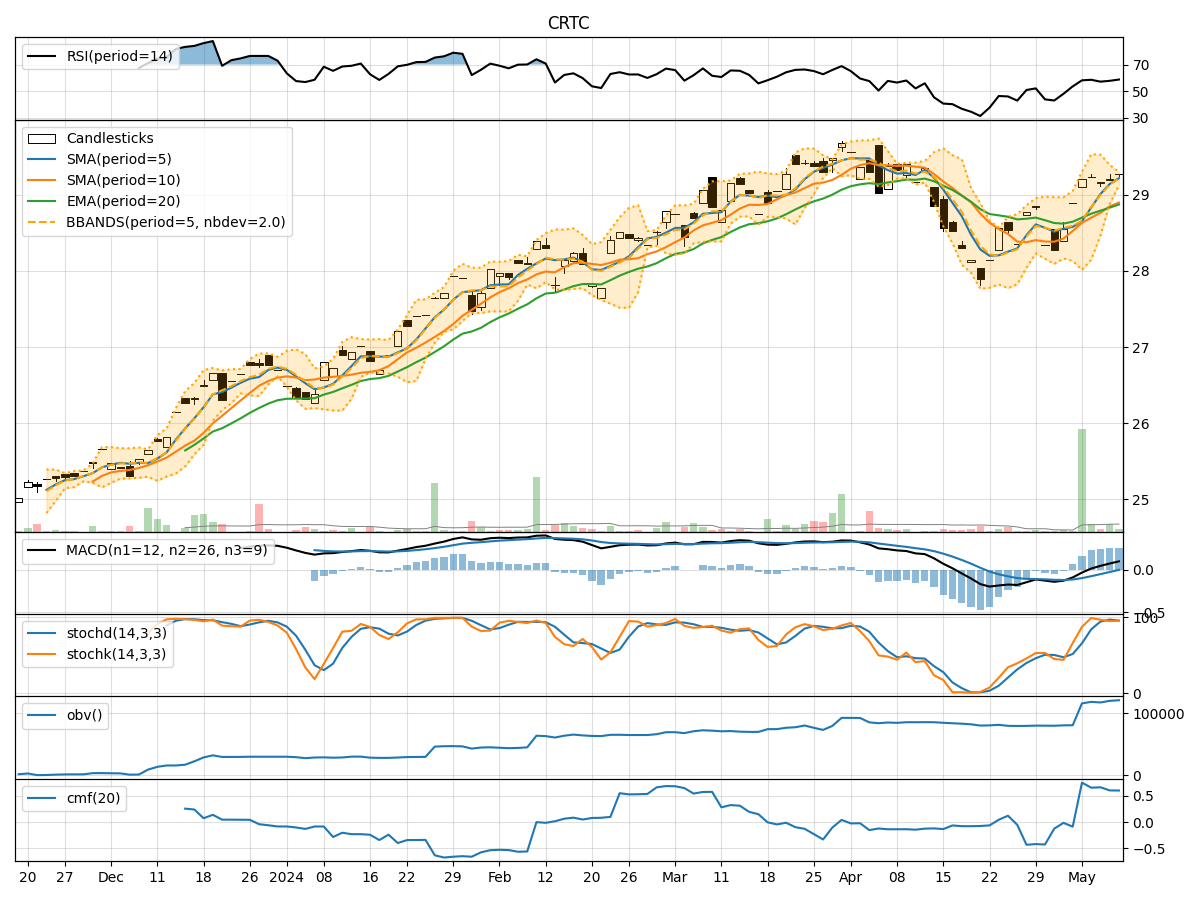
In analyzing the technical indicators for CRTC stock over the last 5 days, we will delve into the trend, momentum, volatility, and volume indicators to provide a comprehensive outlook on the possible stock price movement in the coming days.
Trend Indicators:
- Moving Averages (MA): The 5-day Moving Average has been consistently above the Simple Moving Average (SMA) and Exponential Moving Average (EMA), indicating a bullish trend.
- MACD: The MACD line has been consistently above the signal line, with both lines trending upwards, suggesting a bullish momentum.
- MACD Histogram: The MACD Histogram has been increasing over the past 5 days, indicating strengthening bullish momentum.
Momentum Indicators:
- RSI: The Relative Strength Index (RSI) has been hovering around the 50 level, indicating a neutral momentum.
- Stochastic Oscillator: Both %K and %D lines of the Stochastic Oscillator have been in the overbought zone, suggesting a potential reversal or consolidation.
- Williams %R: The Williams %R has been fluctuating around the oversold and overbought levels, indicating mixed momentum signals.
Volatility Indicators:
- Bollinger Bands: The stock price has been trading within the Bollinger Bands, with the bands narrowing, suggesting a period of low volatility.
- Bollinger %B: The %B indicator has been fluctuating around the midline, indicating a lack of clear trend direction.
Volume Indicators:
- On-Balance Volume (OBV): The OBV has been showing a slight increase over the past 5 days, indicating some accumulation.
- Chaikin Money Flow (CMF): The CMF has been positive but trending downwards, suggesting a potential decrease in buying pressure.
Conclusion:
Based on the analysis of the technical indicators, the stock is currently in a consolidation phase with mixed signals across different indicators. The trend indicators suggest a bullish bias, while momentum indicators show neutral to slightly bearish signals. Volatility is low, indicating a lack of significant price movements, and volume indicators point towards some accumulation but with decreasing buying pressure.
Forecast:
Given the current market dynamics and the mixed signals from the technical indicators, it is likely that the stock price will continue to consolidate in the near term. Traders should exercise caution and wait for clearer signals before taking significant positions. It is advisable to closely monitor key support and resistance levels for potential breakout or breakdown scenarios.