Technical Analysis of CSF 2024-05-10
Overview:
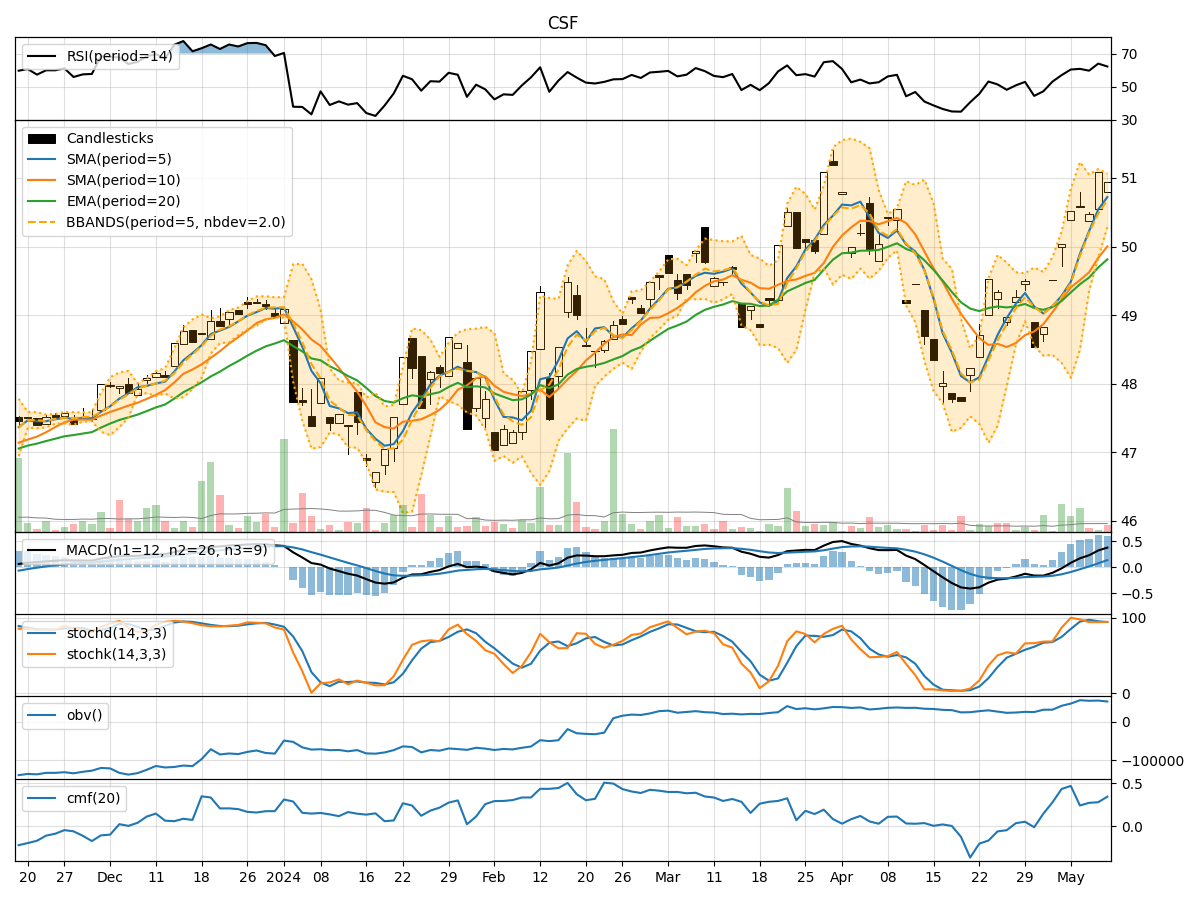
In the last 5 trading days, CSF stock has shown a mixed performance based on various technical indicators. The trend indicators suggest a gradual uptrend, with moving averages and MACD showing positive momentum. Momentum indicators like RSI and Stochastic oscillators indicate a slightly overbought condition. Volatility indicators show a narrowing Bollinger Band, indicating potential consolidation. Volume indicators show a steady accumulation of volume.
Trend Indicators:
- Moving Averages (MA): The 5-day MA has been consistently above the 10-day SMA, indicating a short-term uptrend.
- MACD: The MACD line has been above the signal line, indicating bullish momentum.
- EMA: The EMA has been steadily increasing, supporting the uptrend.
Key Observation: The trend indicators suggest an upward movement in the stock price.
Momentum Indicators:
- RSI: The RSI is in the neutral to slightly overbought territory, indicating potential for a pullback.
- Stochastic Oscillators: Both %K and %D are in the overbought zone, suggesting a possible reversal.
- Williams %R: The indicator is also in the overbought region, signaling a potential reversal.
Key Observation: Momentum indicators suggest a potential pullback or consolidation in the stock price.
Volatility Indicators:
- Bollinger Bands (BB): The bands are narrowing, indicating decreasing volatility and a potential period of consolidation.
- Bollinger Band %B: The %B is hovering around 0.7, suggesting the stock is trading near the upper band.
Key Observation: Volatility indicators point towards a consolidation phase in the stock price.
Volume Indicators:
- On-Balance Volume (OBV): The OBV has been steadily increasing, indicating accumulation of volume.
- Chaikin Money Flow (CMF): The CMF is positive, suggesting buying pressure in the stock.
Key Observation: Volume indicators support the upward movement in the stock price.
Conclusion:
Based on the analysis of the technical indicators, the next few days may see a potential pullback or consolidation in the stock price after the recent uptrend. The momentum indicators suggest a temporary overbought condition, while volatility indicators point towards a period of consolidation. However, the overall trend remains upward supported by moving averages and MACD. Traders should be cautious of a possible pullback and monitor key support levels for potential buying opportunities.