Technical Analysis of CSM 2024-05-10
Overview:
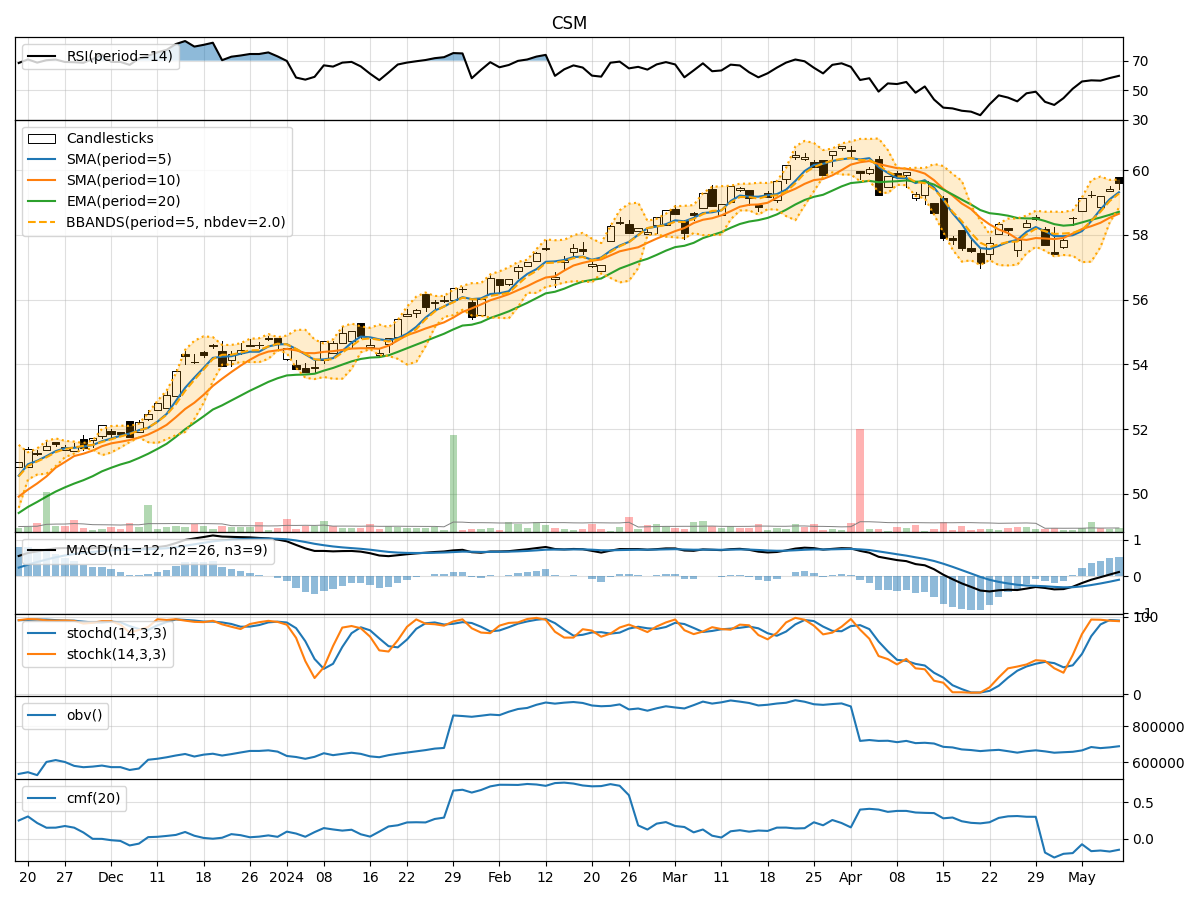
In the last 5 trading days, the stock has shown a consistent uptrend in terms of closing prices. The moving averages (MA) have been trending upwards, indicating a positive momentum. The MACD and RSI have also been showing bullish signals. However, the stock is currently trading near the upper Bollinger Band, suggesting a potential overbought condition. The volume indicators have been mixed, with the On-Balance Volume (OBV) showing a slight decrease.
Trend Analysis:
- Moving Averages (MA): The 5-day MA has been consistently above the 10-day SMA and 20-day EMA, indicating a strong uptrend.
- MACD: The MACD line has been above the signal line for the past 5 days, showing bullish momentum.
- Bollinger Bands (BB): The stock is currently trading near the upper Bollinger Band, suggesting a potential overbought condition.
Momentum Analysis:
- RSI: The RSI has been increasing and is currently in the overbought territory, indicating a strong bullish momentum.
- Stochastic Oscillator: Both %K and %D have been in the overbought zone, suggesting a potential reversal or consolidation.
- Williams %R: The Williams %R is in the oversold territory, indicating a potential reversal to the upside.
Volatility Analysis:
- Bollinger Bands (BB): The width of the Bollinger Bands has been narrowing, indicating decreasing volatility.
- Bollinger %B (BBP): The %B is above 0.8, suggesting a potential overbought condition.
Volume Analysis:
- On-Balance Volume (OBV): The OBV has been slightly decreasing over the last 5 days, indicating a divergence between price and volume.
Key Observations:
- The stock is currently in a strong uptrend based on moving averages and momentum indicators.
- However, the stock is trading near the upper Bollinger Band and showing signs of overbought conditions.
- The volume indicators are not confirming the price movement, as OBV is slightly decreasing.
Conclusion:
Based on the technical analysis of the trend, momentum, volatility, and volume indicators, the stock is likely to experience a short-term consolidation or pullback in the next few days. The overbought conditions indicated by the RSI, Stochastic Oscillator, and Bollinger Bands suggest a potential reversal or sideways movement. Traders should exercise caution and consider taking profits or waiting for a better entry point before considering long positions.