Technical Analysis of CSMD 2024-05-10
Overview:
In analyzing the technical indicators for CSMD over the last 5 days, we will delve into the trend, momentum, volatility, and volume indicators to provide a comprehensive outlook on the possible stock price movement in the coming days. By examining these key indicators, we aim to offer valuable insights and predictions for potential investors.
Trend Indicators:
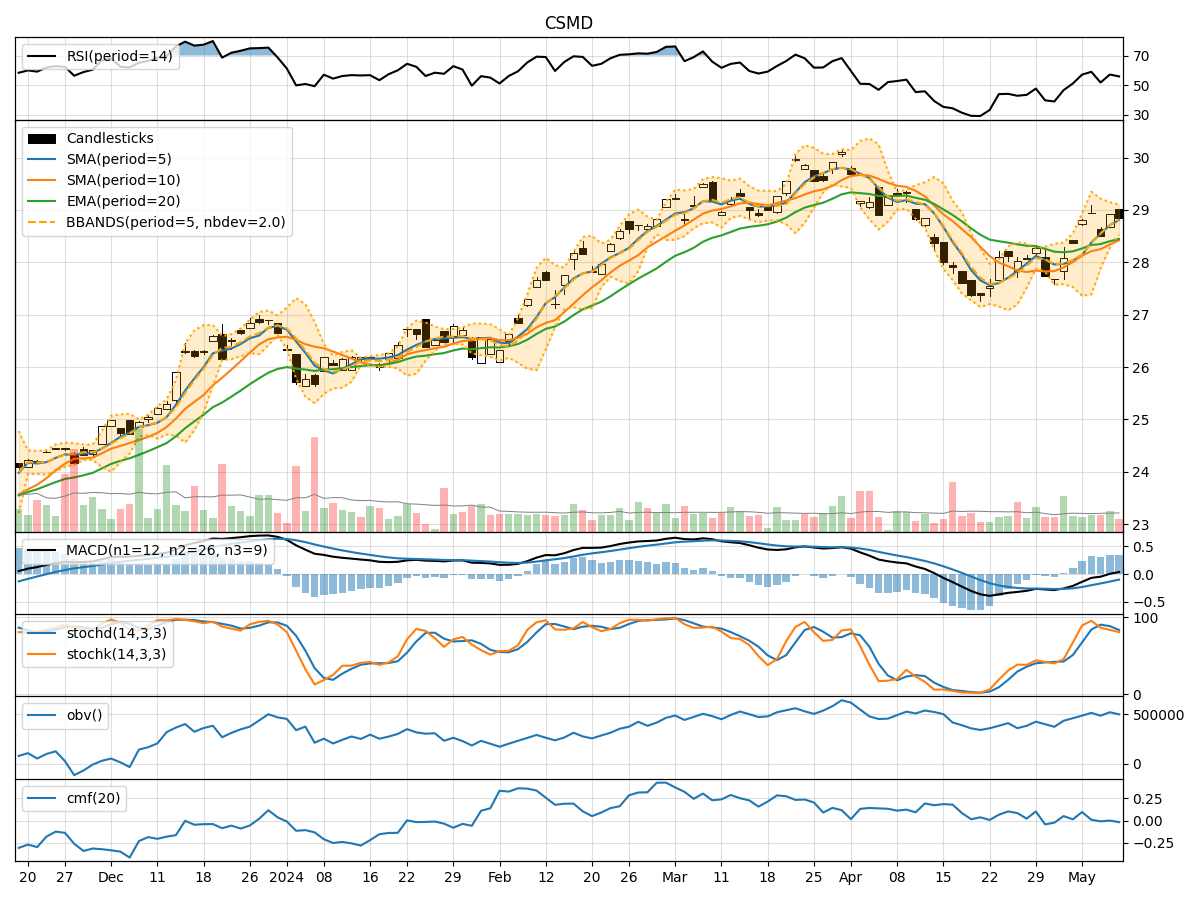
- Moving Averages (MA): The 5-day MA has been trending above the longer-term SMAs, indicating a short-term bullish trend.
- MACD: The MACD line has been consistently above the signal line, suggesting bullish momentum.
- EMA: The EMA has been showing a gradual uptrend, supporting the bullish sentiment.
Momentum Indicators:
- RSI: The RSI has been fluctuating around the neutral zone, indicating indecision in the market.
- Stochastic Oscillator: Both %K and %D have been declining, signaling a potential bearish momentum.
- Williams %R: The indicator has been hovering in the oversold territory, suggesting a possible reversal.
Volatility Indicators:
- Bollinger Bands (BB): The bands have been narrowing, indicating decreasing volatility.
- BB %B: The %B has been fluctuating within a tight range, reflecting consolidation.
- BB Width: The narrowing of the bands suggests a potential breakout or significant price movement.
Volume Indicators:
- On-Balance Volume (OBV): The OBV has been relatively stable, indicating a balance between buying and selling pressure.
- Chaikin Money Flow (CMF): The CMF has been negative, suggesting outflows from the stock.
Key Observations:
- The trend indicators point towards a bullish sentiment in the short term.
- Momentum indicators show mixed signals with a slight bearish bias.
- Volatility indicators suggest a period of consolidation and potential breakout.
- Volume indicators indicate a balanced market sentiment with a slight selling pressure.
Conclusion:
Based on the analysis of the technical indicators, the next few days for CSMD could see sideways consolidation with a slight bearish bias. Traders should exercise caution and closely monitor key support and resistance levels for potential entry or exit points. It is advisable to wait for more clarity in market direction before making significant trading decisions.