Technical Analysis of CTEC 2024-05-10
Overview:
In analyzing the technical indicators for CTEC over the last 5 days, we will delve into the trend, momentum, volatility, and volume indicators to provide a comprehensive assessment of the stock's potential price movement. By examining these key factors, we aim to offer valuable insights and predictions for the upcoming days.
Trend Analysis:
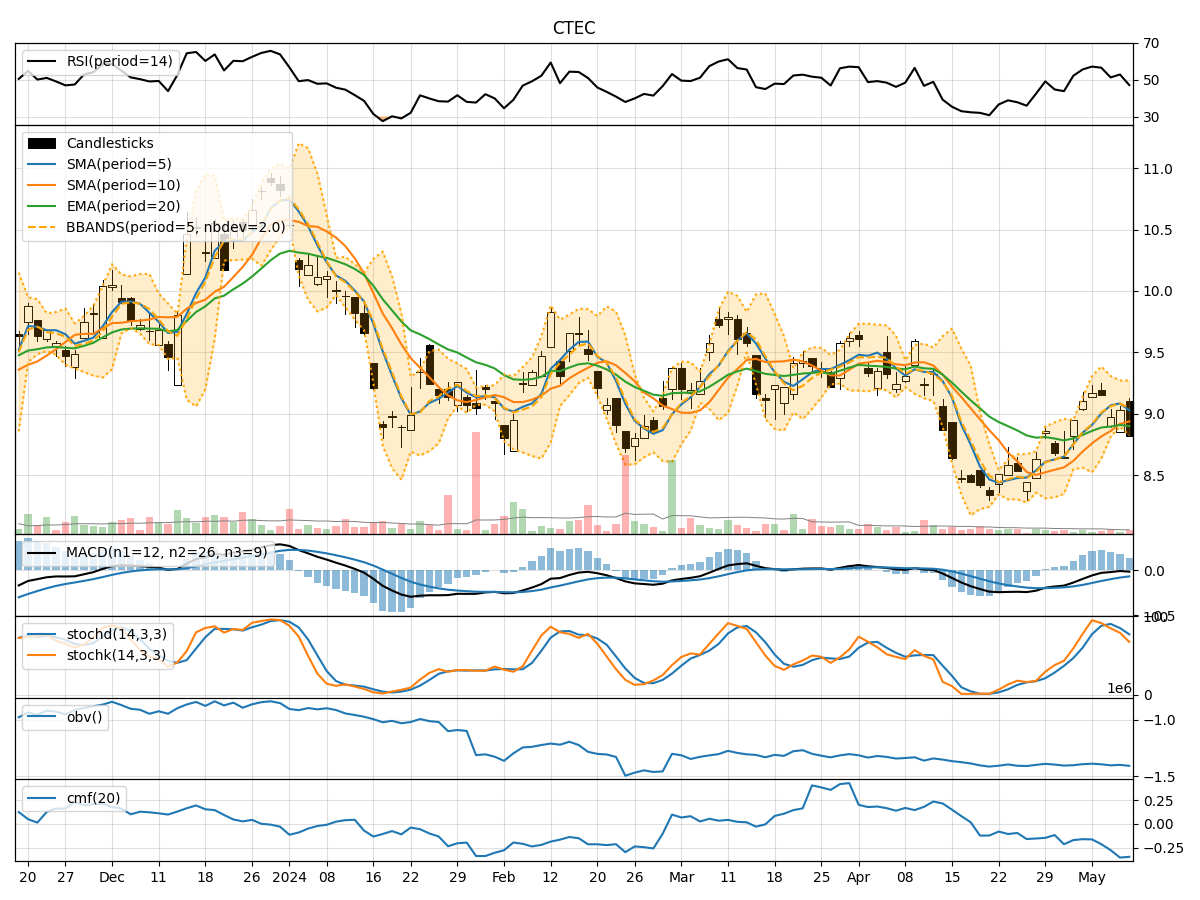
- Moving Averages (MA): The 5-day Moving Average (MA) has been fluctuating around the current price, indicating a lack of clear trend direction.
- MACD: The Moving Average Convergence Divergence (MACD) has been consistently negative, suggesting a bearish momentum in the short term.
- EMA: The Exponential Moving Average (EMA) has been relatively stable but slightly declining, reflecting a potential weakening trend.
Momentum Analysis:
- RSI: The Relative Strength Index (RSI) has been hovering around the neutral zone, indicating a balanced momentum between buying and selling pressure.
- Stochastic Oscillator: Both %K and %D of the Stochastic Oscillator have been decreasing, signaling a potential bearish momentum.
- Williams %R: The Williams %R is in the oversold territory, suggesting a possible reversal or bounce in the near future.
Volatility Analysis:
- Bollinger Bands: The Bollinger Bands have been narrowing, indicating decreasing volatility and a potential period of consolidation.
- Bollinger %B: The %B indicator is approaching the lower band, suggesting a possible oversold condition and a potential reversal.
Volume Analysis:
- On-Balance Volume (OBV): The OBV has been declining, indicating a net selling pressure in the stock.
- Chaikin Money Flow (CMF): The CMF has been consistently negative, reflecting a lack of buying interest and potential bearish sentiment.
Key Observations:
- The trend indicators suggest a lack of clear direction, with a slightly bearish bias in the short term.
- Momentum indicators point towards a potential bearish momentum, although some oversold conditions may lead to a reversal.
- Volatility indicators indicate decreasing volatility and a possible period of consolidation.
- Volume indicators show a consistent selling pressure and a lack of buying interest in the stock.
Conclusion:
Based on the analysis of the technical indicators, the overall outlook for CTEC in the next few days is bearish. The stock is likely to experience further downward pressure, potentially leading to a continuation of the current downtrend. Traders and investors should exercise caution and consider short-term selling strategies or wait for a clearer signal of a trend reversal before considering long positions.