Technical Analysis of CTEX 2024-05-10
Overview:
In analyzing the technical indicators for CTEX over the last 5 days, we will delve into the trend, momentum, volatility, and volume indicators to provide a comprehensive outlook on the possible stock price movement in the coming days.
Trend Indicators:
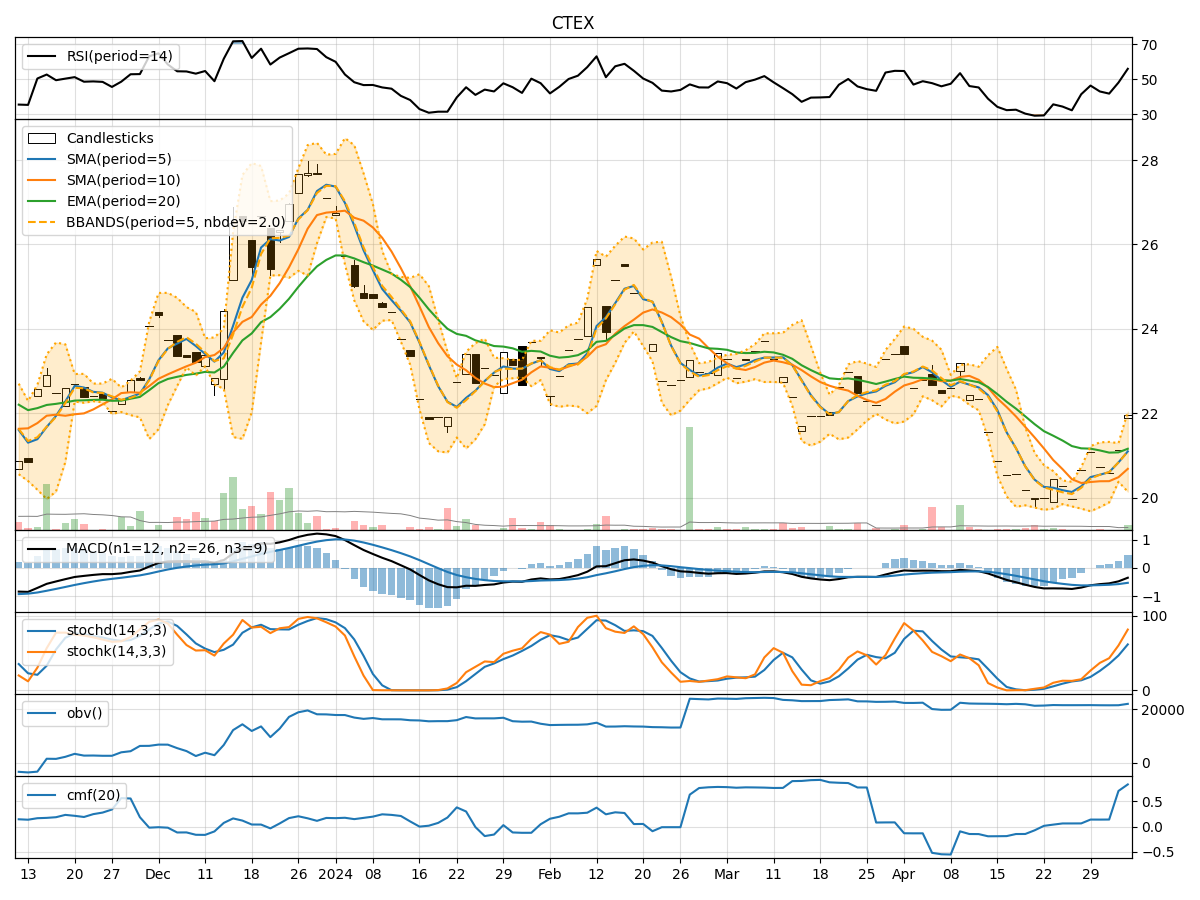
- Moving Averages (MA): The 5-day Moving Average (MA) has been consistently above the Simple Moving Average (SMA) and Exponential Moving Average (EMA), indicating a bullish trend.
- MACD: The MACD line has been consistently below the signal line, suggesting a bearish trend.
- MACD Histogram: The MACD Histogram has been positive, indicating potential bullish momentum.
Momentum Indicators:
- RSI: The Relative Strength Index (RSI) has been fluctuating around the neutral zone, indicating indecision in the market.
- Stochastic Oscillator: Both %K and %D have been declining, signaling a potential bearish momentum.
- Williams %R: The Williams %R is in oversold territory, suggesting a possible reversal.
Volatility Indicators:
- Bollinger Bands (BB): The stock price has been trading within the Bollinger Bands, indicating normal volatility.
- Bollinger Band %B: The %B indicator is close to 0.5, suggesting the stock is trading near the middle of the bands.
Volume Indicators:
- On-Balance Volume (OBV): The OBV has been relatively flat, indicating no significant accumulation or distribution.
- Chaikin Money Flow (CMF): The CMF has been positive, suggesting buying pressure in the market.
Key Observations:
- The trend indicators show a mixed signal with the moving averages indicating a bullish trend, while the MACD suggests a bearish trend.
- Momentum indicators point towards a potential bearish momentum with the Stochastic Oscillator in decline.
- Volatility remains relatively stable within the Bollinger Bands, indicating no extreme price movements.
- Volume indicators show neutral activity with OBV flat and CMF slightly positive.
Conclusion:
Based on the analysis of the technical indicators, the stock price of CTEX is likely to experience further downward movement in the coming days. The bearish signals from the MACD and Stochastic Oscillator, coupled with the lack of strong bullish momentum from other indicators, suggest a bearish outlook. Traders should exercise caution and consider short-term selling opportunities.