Technical Analysis of CURE 2024-05-10
Overview:
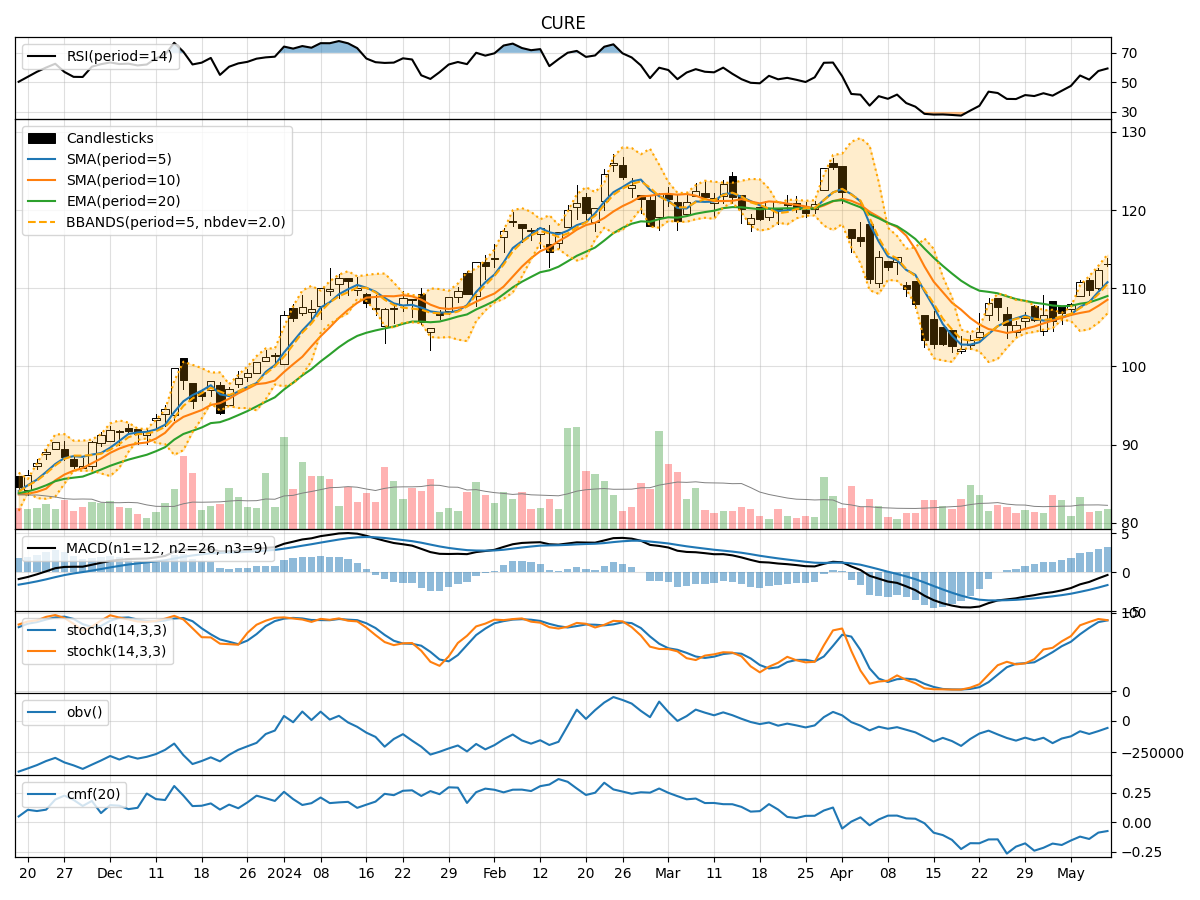
In analyzing the technical indicators for CURE stock over the last 5 days, we will delve into the trend, momentum, volatility, and volume indicators to provide a comprehensive outlook on the possible stock price movement in the coming days.
Trend Indicators:
- Moving Averages (MA): The 5-day Moving Average has been consistently above the Simple Moving Average (SMA) and Exponential Moving Average (EMA), indicating a bullish trend.
- MACD: The MACD line has been consistently above the signal line, with both lines showing an upward trend, suggesting bullish momentum.
- MACD Histogram: The MACD Histogram has been increasing over the past 5 days, indicating strengthening bullish momentum.
Momentum Indicators:
- RSI: The Relative Strength Index (RSI) has been trending upwards and is currently in the neutral zone, suggesting potential for further upside.
- Stochastic Oscillator: Both %K and %D lines of the Stochastic Oscillator are in the overbought zone, indicating a strong bullish momentum.
- Williams %R: The Williams %R is in the oversold territory, suggesting a potential reversal to the upside.
Volatility Indicators:
- Bollinger Bands: The stock price has been consistently trading above the middle Bollinger Band (BBM), indicating an uptrend. The bands are relatively narrow, suggesting low volatility.
- Bollinger %B: The %B indicator is above 0.5, indicating that the price is closer to the upper band, signaling a bullish trend.
Volume Indicators:
- On-Balance Volume (OBV): The OBV has been increasing over the past 5 days, indicating accumulation by investors.
- Chaikin Money Flow (CMF): The CMF has been negative but trending upwards, suggesting a potential shift towards buying pressure.
Key Observations and Opinions:
- Trend: The trend indicators suggest a strong bullish sentiment in the stock, supported by moving averages and MACD analysis.
- Momentum: Momentum indicators like RSI and Stochastic Oscillator indicate a bullish momentum, with potential for further upside.
- Volatility: Low volatility as indicated by Bollinger Bands suggests a stable uptrend with limited price fluctuations.
- Volume: Increasing OBV and improving CMF indicate growing buying interest in the stock.
Conclusion:
Based on the analysis of technical indicators, the next few days for CURE stock are likely to see continued upward movement. The bullish trend, supported by momentum, low volatility, and increasing buying volume, suggests a favorable outlook for the stock price. Traders and investors may consider buying opportunities in CURE stock for potential gains in the coming days.