Technical Analysis of CUT 2024-05-10
Overview:
In analyzing the technical indicators for the stock CUT over the last 5 days, we will delve into the trends, momentum, volatility, and volume indicators to provide a comprehensive outlook on the possible future stock price movements. By examining these key aspects, we aim to offer valuable insights and predictions for the upcoming trading days.
Trend Indicators:
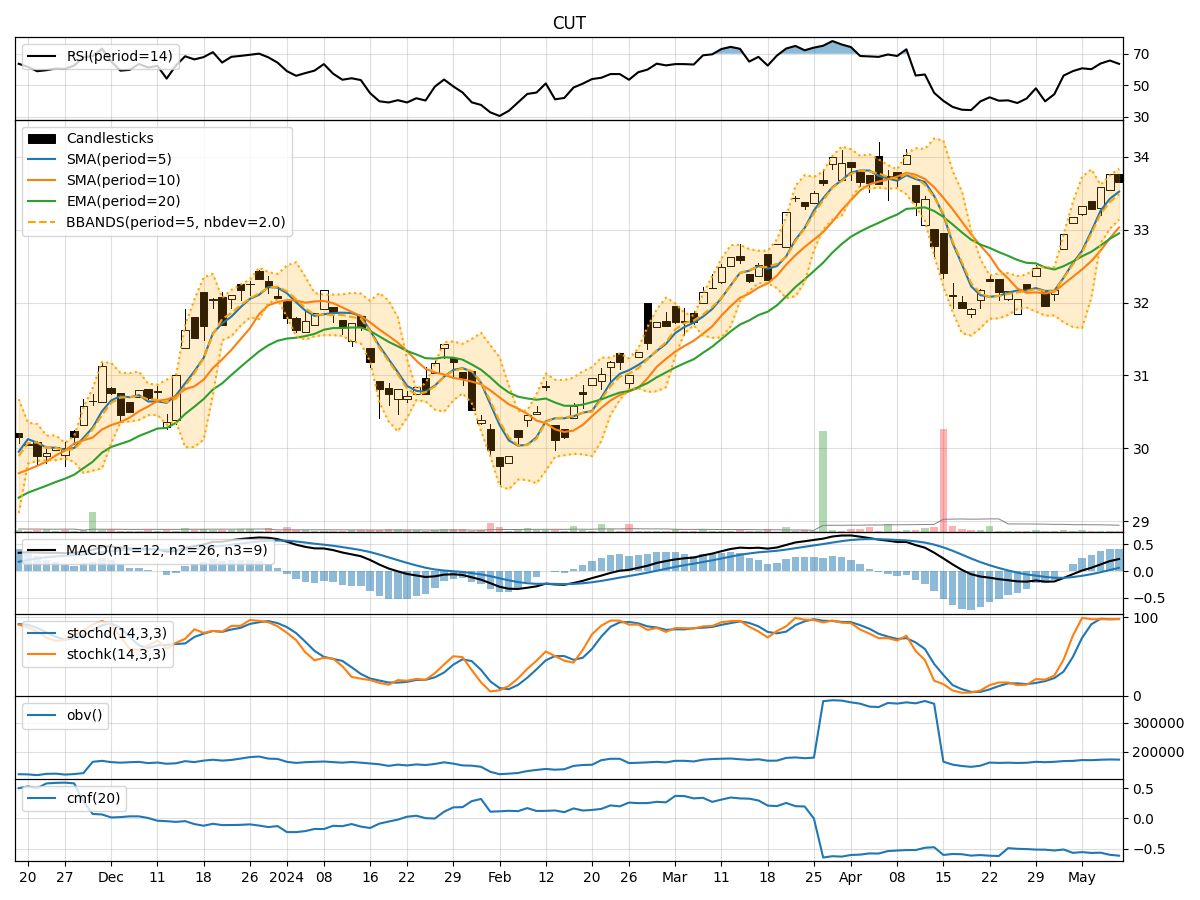
- Moving Averages (MA): The moving averages have been trending upwards over the last 5 days, indicating a positive momentum in the stock price.
- MACD and Signal Line: The MACD has been consistently positive, suggesting a bullish trend in the stock.
- MACD Histogram: The MACD histogram has been increasing, further supporting the bullish sentiment in the stock.
Momentum Indicators:
- RSI: The RSI has been in the overbought territory, indicating a strong bullish momentum in the stock.
- Stochastic Oscillator: Both %K and %D have been high, signaling a strong buying pressure in the stock.
- Williams %R: The Williams %R has been negative, suggesting a potential reversal in the stock price.
Volatility Indicators:
- Bollinger Bands: The Bollinger Bands have been widening, indicating increased volatility in the stock price.
- Bollinger %B: The %B has been fluctuating within a range, suggesting potential price reversals.
- Average True Range (ATR): The ATR has been relatively stable, indicating consistent volatility levels.
Volume Indicators:
- On-Balance Volume (OBV): The OBV has been increasing, reflecting strong buying volume in the stock.
- Chaikin Money Flow (CMF): The CMF has been negative, indicating a potential outflow of money from the stock.
Key Observations and Opinions:
- Trend: The stock has been in a strong uptrend based on moving averages and MACD analysis.
- Momentum: The momentum indicators suggest a bullish sentiment in the stock.
- Volatility: The widening Bollinger Bands indicate increased volatility, which could lead to larger price swings.
- Volume: The increasing OBV signals strong buying volume, while the negative CMF raises concerns about potential profit-taking.
Conclusion:
Based on the analysis of the technical indicators, the next few days' possible stock price movement for CUT is likely to continue in an upward direction. The bullish trend, strong momentum, and increasing buying volume support a positive outlook for the stock. However, investors should closely monitor the volatility levels and be cautious of potential price reversals indicated by certain indicators. Overall, the bias remains bullish for the upcoming trading days.