Technical Analysis of CVAR 2024-05-10
Overview:
In analyzing the technical indicators for the last 5 days of CVAR stock, we will delve into the trend, momentum, volatility, and volume indicators to provide insights into the possible future stock price movements. By examining these indicators, we aim to offer a comprehensive analysis and make informed predictions for the upcoming days.
Trend Indicators:
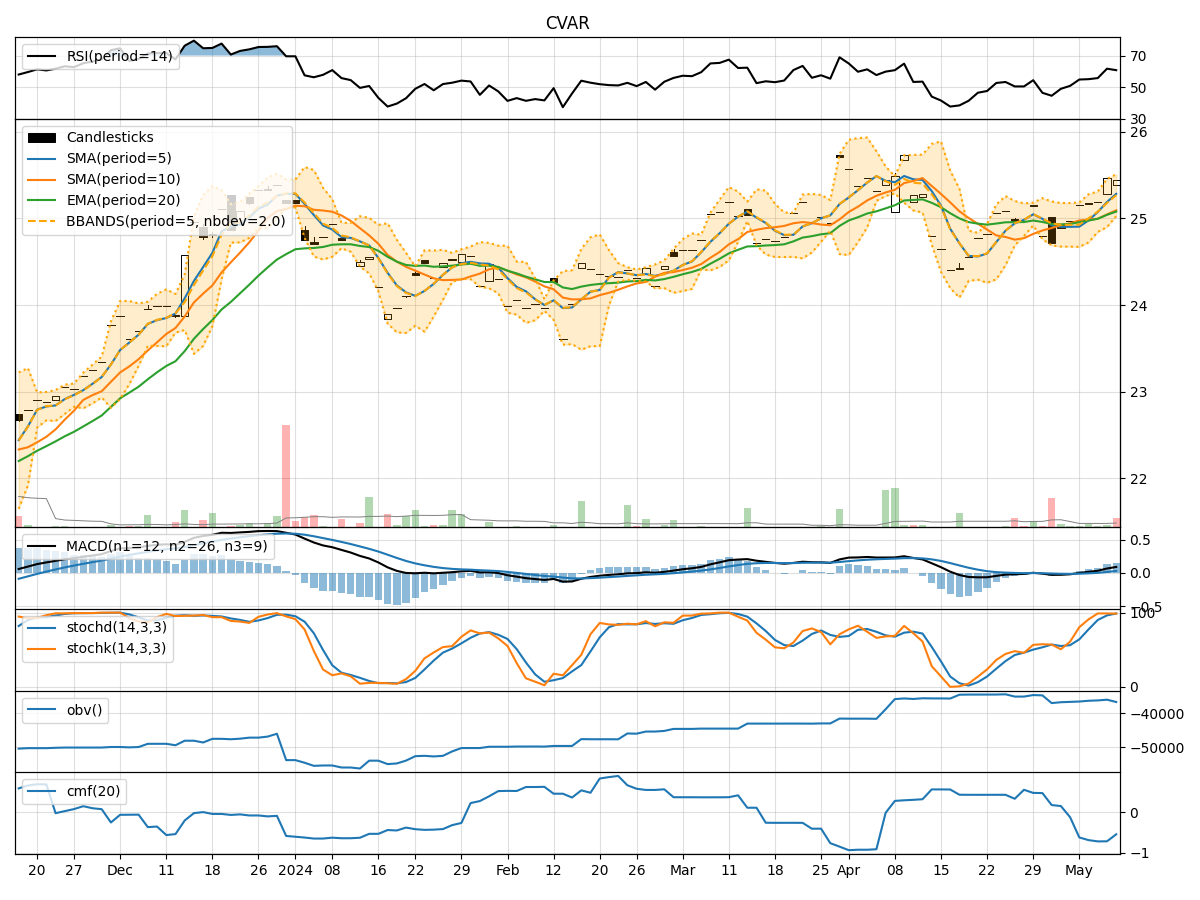
- Moving Averages (MA): The 5-day moving average has been consistently above the closing prices, indicating a bullish trend.
- MACD: The MACD line has been consistently positive, suggesting upward momentum in the stock price.
- RSI: The Relative Strength Index has been fluctuating around the neutral zone, indicating a balanced market sentiment.
Momentum Indicators:
- Stochastic Oscillator: The stochastic indicators have been in the overbought zone, suggesting a potential reversal or consolidation.
- Williams %R: The Williams %R has been hovering around the oversold territory, indicating a possible buying opportunity.
Volatility Indicators:
- Bollinger Bands: The Bollinger Bands have been relatively narrow, indicating low volatility in the stock price.
- Average True Range (ATR): The ATR values have been stable, suggesting consistent price movements.
Volume Indicators:
- On-Balance Volume (OBV): The OBV has shown a slight increase, indicating accumulation by investors.
- Chaikin Money Flow (CMF): The CMF has been negative, suggesting selling pressure in the stock.
Key Observations:
- The trend indicators suggest a bullish sentiment in the short term.
- Momentum indicators indicate a potential reversal or consolidation due to overbought conditions.
- Volatility indicators point towards low volatility and stable price movements.
- Volume indicators show mixed signals with slight accumulation but overall selling pressure.
Conclusion:
Based on the analysis of the technical indicators, the next few days for CVAR stock are likely to see sideways consolidation with a slight upward bias. Traders should be cautious of the overbought conditions indicated by the momentum indicators and monitor for any signs of reversal. Additionally, the low volatility environment suggests limited price fluctuations, while the volume indicators hint at ongoing selling pressure despite some accumulation. Overall, a cautiously bullish view is recommended for the upcoming days.