Technical Analysis of CVIE 2024-05-10
Overview:
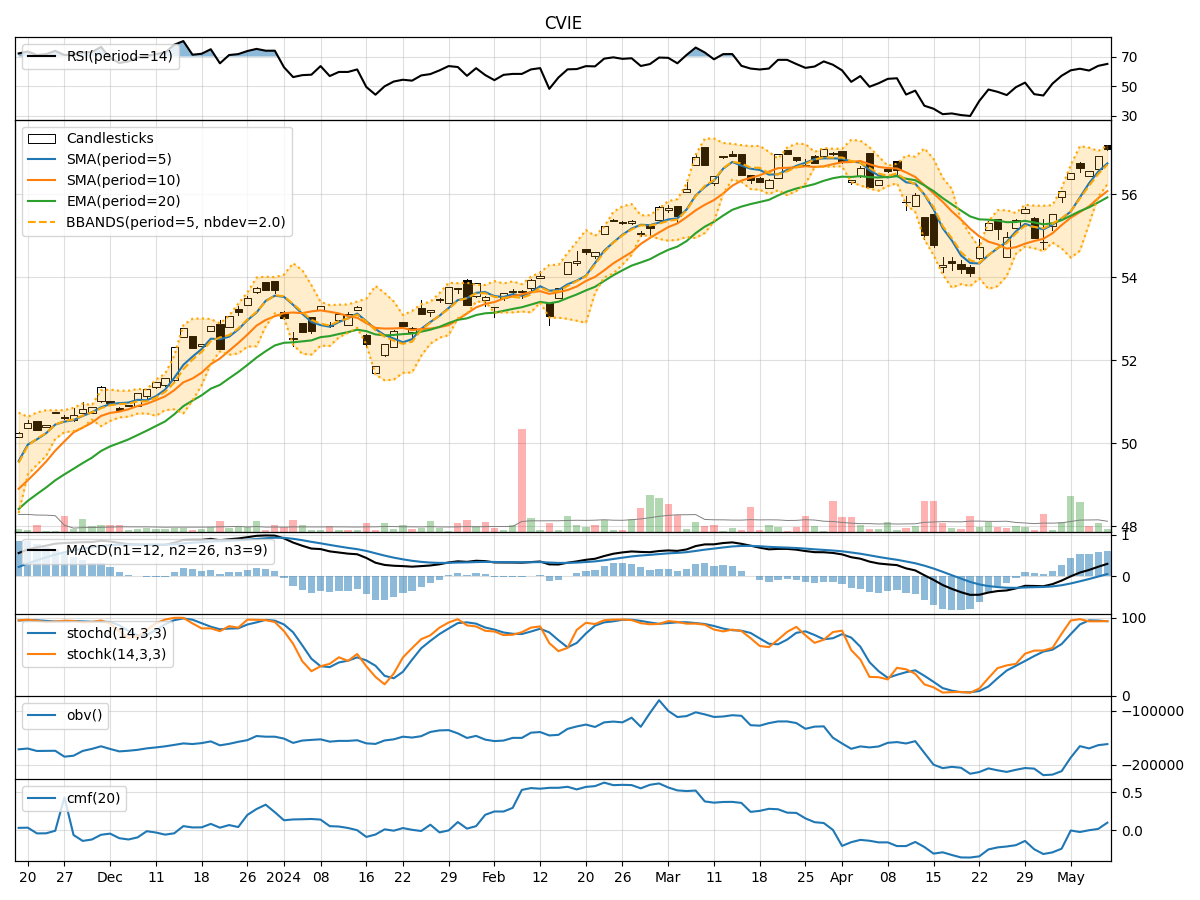
In analyzing the technical indicators for CVIE over the last 5 days, we will delve into the trend, momentum, volatility, and volume indicators to provide a comprehensive outlook on the possible stock price movement in the coming days.
Trend Analysis:
- Moving Averages (MA): The 5-day MA has been consistently above the 10-day SMA, indicating a short-term bullish trend.
- Exponential Moving Average (EMA): The EMA has been steadily increasing, reflecting positive price momentum.
- Moving Average Convergence Divergence (MACD): The MACD and signal line have been trending upwards, suggesting bullish momentum.
Momentum Analysis:
- Relative Strength Index (RSI): RSI values have been in the overbought territory, indicating a strong bullish momentum.
- Stochastic Oscillator (Stoch): Stochastics have been high, suggesting potential overbought conditions.
- Williams %R (WillR): WillR values have been fluctuating around oversold levels, indicating potential reversal points.
Volatility Analysis:
- Bollinger Bands (BB): The price has been trading within the upper Bollinger Band, indicating an uptrend with increased volatility.
- Bollinger Band Width (BBW): The BBW has been expanding, suggesting increased price volatility.
- Bollinger Band %B (BBP): BBP values have been above 0.5, indicating an uptrend with strong price momentum.
Volume Analysis:
- On-Balance Volume (OBV): OBV has been increasing, reflecting accumulation and potential buying pressure.
- Chaikin Money Flow (CMF): CMF values have been positive, indicating money flow into the stock.
Key Observations:
- The trend indicators suggest a bullish sentiment with positive moving averages and MACD.
- Momentum indicators show overbought conditions, signaling a potential reversal or consolidation.
- Volatility indicators point towards an uptrend with increased price fluctuations.
- Volume indicators indicate accumulation and positive money flow into the stock.
Conclusion:
Based on the analysis of technical indicators, the next few days for CVIE are likely to see continued upward movement in the stock price. However, caution is advised as momentum indicators signal potential overbought conditions, which could lead to a short-term consolidation or pullback before resuming the uptrend. Traders should closely monitor key support and resistance levels for potential entry or exit points.