Technical Analysis of CVRD 2024-05-10
Overview:
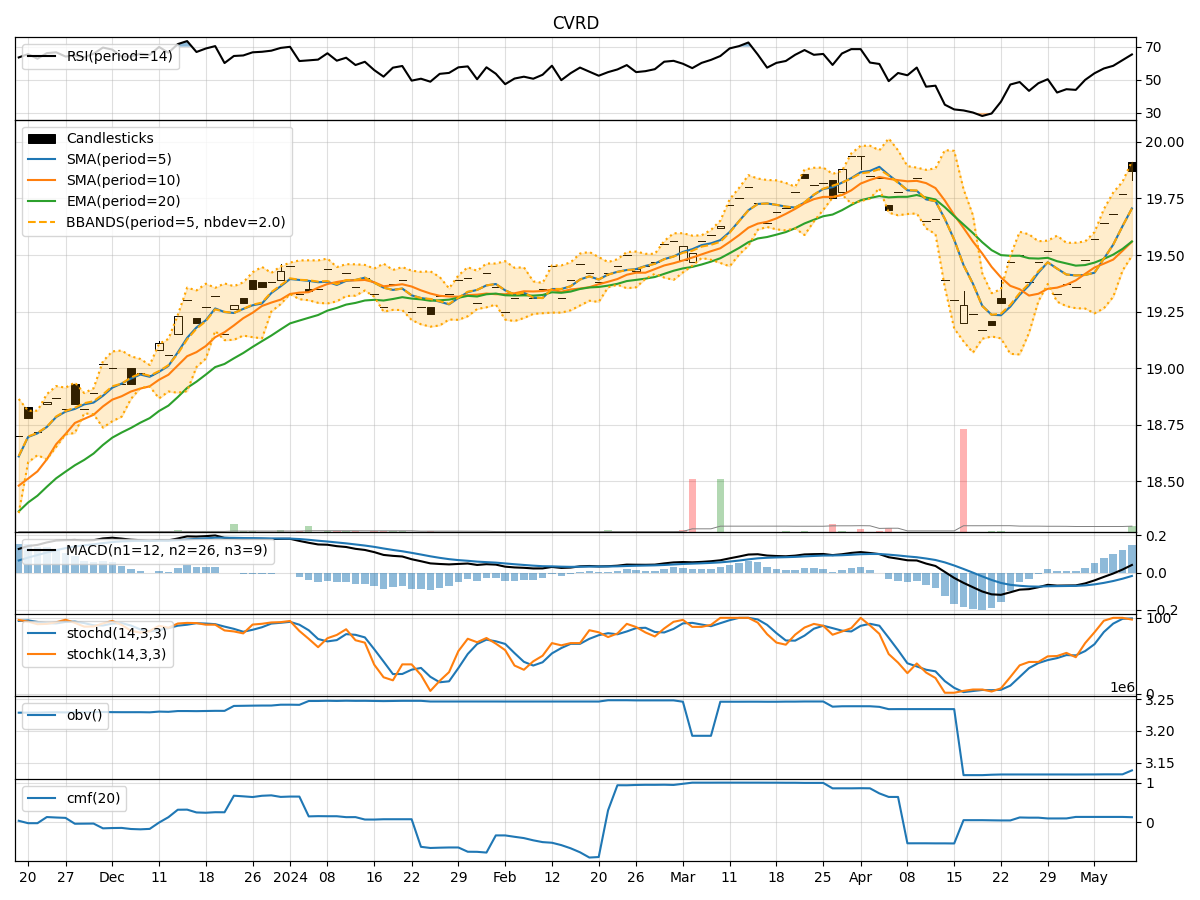
In analyzing the technical indicators for CVRD over the last 5 days, we will delve into the trends, momentum, volatility, and volume aspects to provide a comprehensive outlook on the possible stock price movement. By examining key indicators such as moving averages, MACD, RSI, Bollinger Bands, and OBV, we aim to offer valuable insights and predictions for the upcoming days.
Trend Analysis:
- Moving Averages (MA): The 5-day MA has been consistently above the closing prices, indicating a short-term uptrend.
- MACD: The MACD line has been above the signal line, suggesting bullish momentum.
- EMA: The EMA has been trending upwards, supporting the bullish sentiment.
Key Observation: The trend indicators point towards an upward trajectory for CVRD.
Momentum Analysis:
- RSI: The RSI has been increasing and is currently in the overbought territory, signaling strong buying momentum.
- Stochastic Oscillator: Both %K and %D have been in the overbought zone, indicating a potential reversal.
- Williams %R: The indicator is in the oversold region, suggesting a possible buying opportunity.
Key Observation: Momentum indicators show a mixed signal with potential for a short-term correction.
Volatility Analysis:
- Bollinger Bands: The stock price has been trading within the bands, indicating normal volatility.
Key Observation: Volatility remains stable with no extreme movements.
Volume Analysis:
- On-Balance Volume (OBV): The OBV has been relatively flat, suggesting a balance between buying and selling pressure.
- Chaikin Money Flow (CMF): The CMF is positive, indicating money flow into the stock.
Key Observation: Volume indicators reflect neutral sentiment with no clear bias.
Conclusion:
Based on the analysis of trend, momentum, volatility, and volume indicators, the next few days for CVRD could see further upward movement in the stock price. The trend indicators support a bullish outlook, while momentum indicators hint at a potential short-term correction before resuming the uptrend. Volatility remains stable, and volume indicators show a balanced market sentiment.
Overall Assessment: The stock is likely to experience continued bullish momentum in the near term, with potential for minor corrections along the way. Traders may consider buying on dips for potential gains, while investors should monitor the price action closely for any signs of trend reversal.
Key Conclusion: Upward bias with short-term correction opportunities.