Technical Analysis of CVSE 2024-05-10
Overview:
In analyzing the technical indicators for CVSE over the last 5 days, we will delve into the trend, momentum, volatility, and volume indicators to provide a comprehensive outlook on the possible stock price movement in the coming days. By examining these key indicators, we aim to offer valuable insights and predictions for informed decision-making.
Trend Indicators:
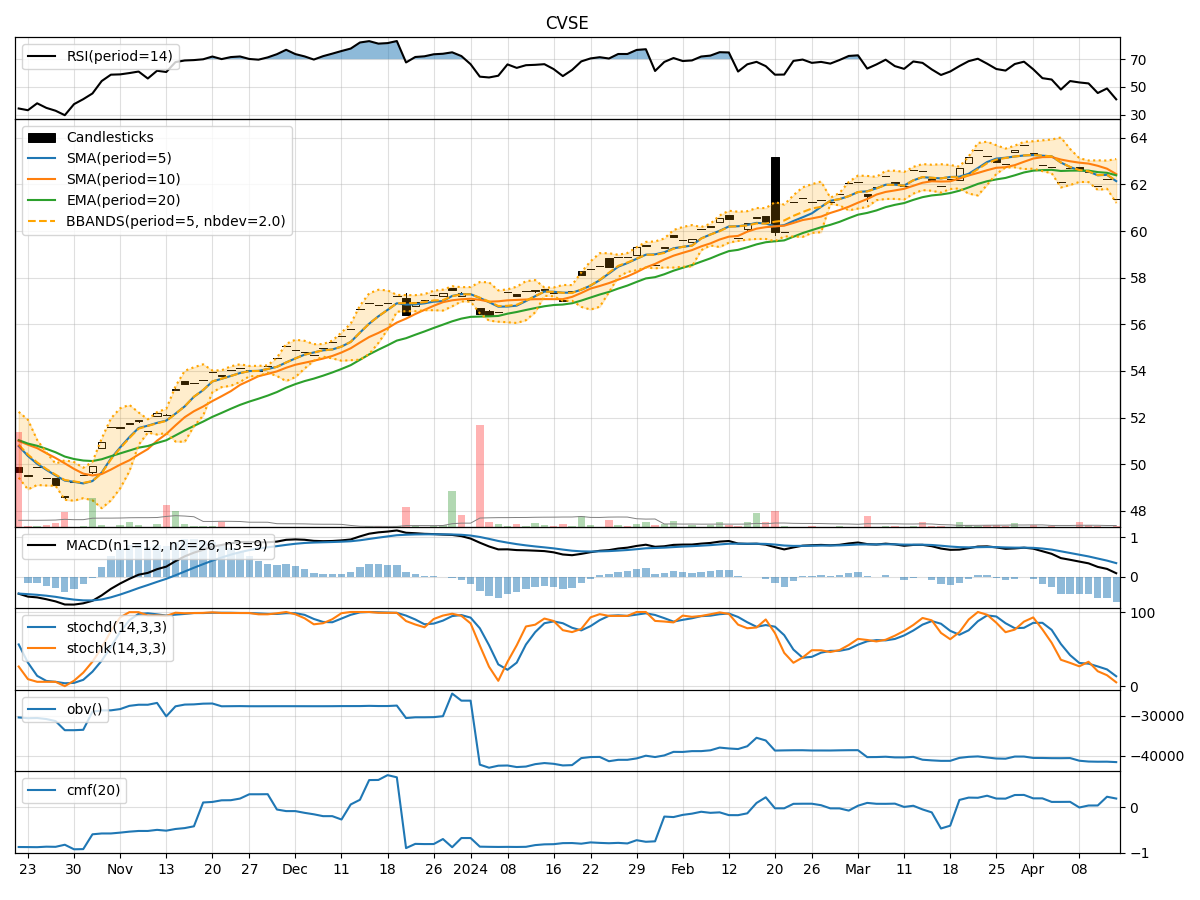
- Moving Averages (MA): The 5-day MA has been consistently above the closing prices, indicating a short-term uptrend.
- MACD: The MACD line has been positive, suggesting bullish momentum.
- MACD Histogram: The histogram has been increasing, indicating strengthening bullish momentum.
Key Observation: The trend indicators suggest a bullish sentiment in the short term.
Momentum Indicators:
- RSI: The RSI has been increasing, reflecting growing buying pressure.
- Stochastic Oscillator: Both %K and %D have been in overbought territory, signaling a strong bullish momentum.
- Williams %R: The indicator has been hovering near oversold levels, indicating potential buying opportunities.
Key Observation: Momentum indicators point towards a strong bullish momentum.
Volatility Indicators:
- Bollinger Bands (BB): The bands have been widening, indicating increased volatility.
- Bollinger %B: The %B has been above 0.8, suggesting the stock is trading near the upper band.
Key Observation: Volatility has been increasing, potentially leading to larger price swings.
Volume Indicators:
- On-Balance Volume (OBV): The OBV has been declining, indicating distribution.
- Chaikin Money Flow (CMF): The CMF has been negative, suggesting selling pressure.
Key Observation: Volume indicators show a divergence with price movement, indicating a potential weakening of the current trend.
Conclusion:
Based on the analysis of the technical indicators, the next few days for CVSE are likely to see continued bullish momentum in the short term. The trend indicators, momentum indicators, and volatility indicators all point towards a positive outlook. However, the divergence in volume indicators raises a cautionary flag, suggesting a potential reversal or consolidation in the near future.
Key Conclusion: The stock is expected to experience upward movement in the coming days, but traders should monitor volume closely for any signs of a trend reversal.
By combining insights from various technical indicators, traders can make more informed decisions and adapt their strategies accordingly to navigate the dynamic stock market landscape effectively.