Technical Analysis of CWS 2024-05-10
Overview:
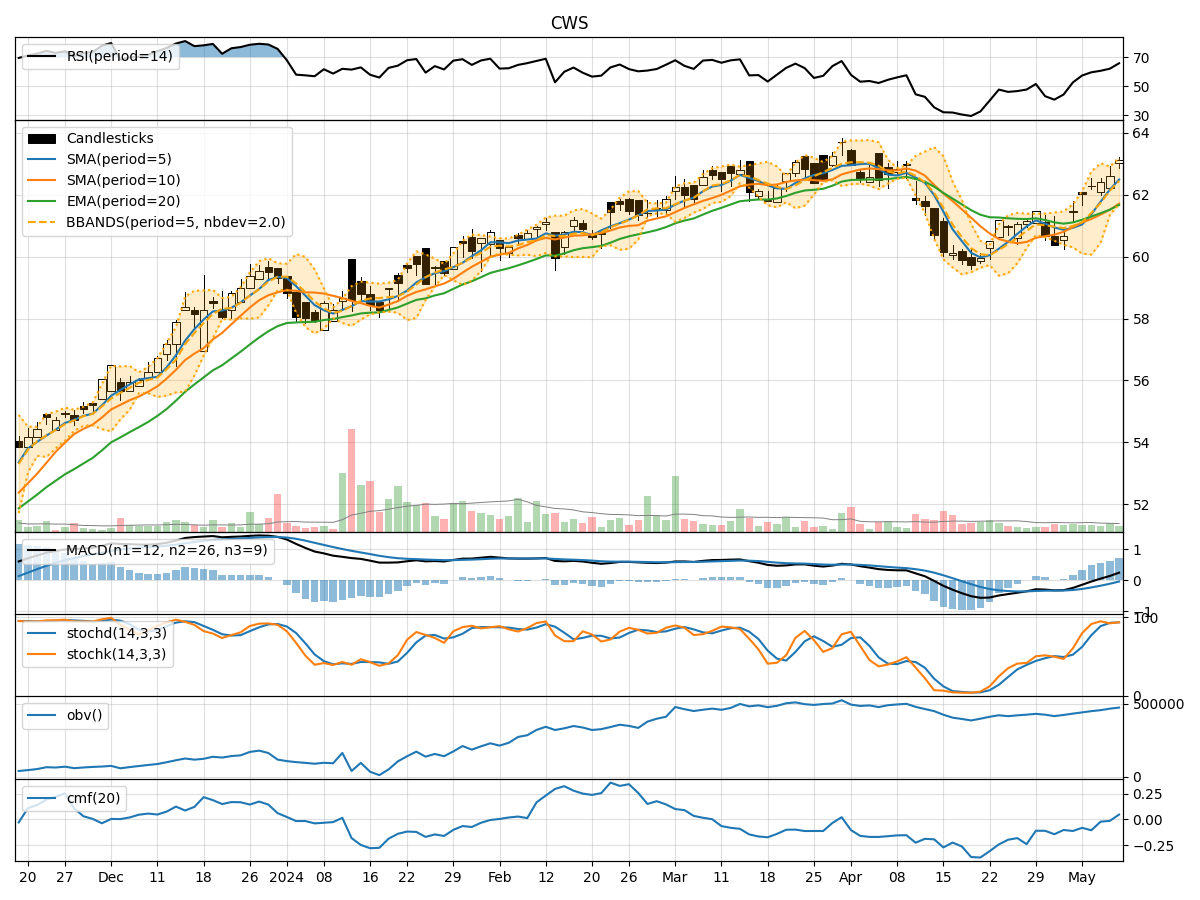
In the last 5 trading days, CWS stock has shown a consistent uptrend in both price and volume. The moving averages have been trending upwards, indicating a bullish sentiment. Momentum indicators like RSI and Stochastic oscillators suggest the stock is in overbought territory but still showing strength. Volatility indicators like Bollinger Bands show a widening range, and volume indicators like OBV and CMF indicate positive accumulation.
Trend Indicators:
- Moving Averages (MA): The 5-day MA has been consistently above the longer-term SMAs and EMAs, indicating a strong bullish trend.
- MACD: The MACD line has been consistently above the signal line, showing bullish momentum.
Key Observation: The trend indicators suggest a strong bullish sentiment in the stock.
Momentum Indicators:
- RSI: RSI has been consistently above 70, indicating overbought conditions but also strong momentum.
- Stochastic Oscillators: Both %K and %D have been in the overbought zone, suggesting a potential reversal.
Key Observation: Momentum indicators are signaling overbought conditions, which might lead to a short-term correction.
Volatility Indicators:
- Bollinger Bands (BB): The bands have been widening, indicating increasing volatility.
Key Observation: The widening Bollinger Bands suggest potential increased price volatility in the near term.
Volume Indicators:
- On-Balance Volume (OBV): OBV has been steadily increasing, indicating strong buying pressure.
- Chaikin Money Flow (CMF): CMF has been positive, showing accumulation in the stock.
Key Observation: Volume indicators confirm the bullish sentiment with increasing buying pressure.
Conclusion:
Based on the technical analysis of trend, momentum, volatility, and volume indicators, the next few days' possible stock price movement for CWS is likely to continue in an upward direction. The strong bullish trend indicated by moving averages and MACD, coupled with positive volume indicators, suggests that the stock is poised for further gains. However, the overbought conditions highlighted by momentum indicators like RSI and Stochastic oscillators may lead to a short-term correction or consolidation before resuming the uptrend.
Overall View: Bullish with a potential short-term correction or consolidation due to overbought conditions. Long-term outlook remains positive based on the technical indicators analyzed.