Technical Analysis of DAPR 2024-05-10
Overview:
In analyzing the technical indicators for DAPR stock over the last 5 days, we will delve into the trend, momentum, volatility, and volume indicators to provide a comprehensive outlook on the possible stock price movement in the coming days. By examining these key indicators, we aim to offer valuable insights and recommendations for potential investors.
Trend Indicators:
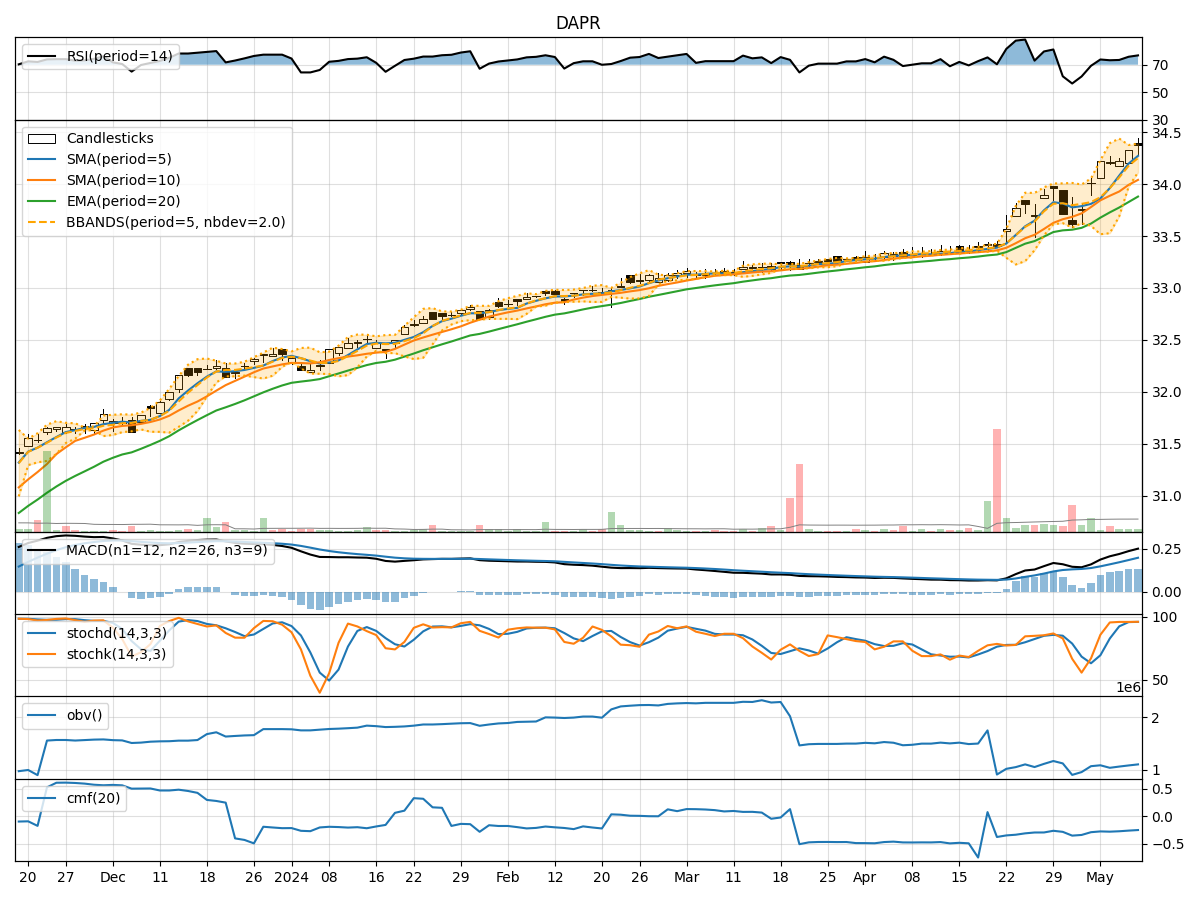
- Moving Averages (MA): The 5-day moving average has been consistently above the simple moving average (SMA) and exponential moving average (EMA), indicating a bullish trend.
- MACD: The MACD line has been consistently above the signal line, with both lines showing an upward trend, suggesting bullish momentum.
- Conclusion: The trend indicators point towards an upward trend for DAPR stock.
Momentum Indicators:
- RSI: The Relative Strength Index (RSI) has been in the overbought territory, indicating strong buying momentum.
- Stochastic Oscillator: Both %K and %D have been in the overbought zone, suggesting a potential reversal.
- Conclusion: Momentum indicators signal a potential reversal or a period of consolidation for DAPR stock.
Volatility Indicators:
- Bollinger Bands: The stock price has been trading within the upper Bollinger Band, indicating increased volatility.
- Conclusion: Volatility indicators suggest increased volatility in the stock price.
Volume Indicators:
- On-Balance Volume (OBV): The OBV has been declining, indicating selling pressure in the stock.
- Chaikin Money Flow (CMF): The CMF has been negative, suggesting outflow of money from the stock.
- Conclusion: Volume indicators point towards bearish sentiment in the stock.
Conclusion:
Based on the analysis of trend, momentum, volatility, and volume indicators, the next few days' possible stock price movement for DAPR is as follows: - The trend indicators suggest an upward trend. - Momentum indicators indicate a potential reversal or consolidation phase. - Volatility indicators point towards increased volatility. - Volume indicators signal bearish sentiment.
Overall Assessment:
Considering the mixed signals from different indicators, it is crucial to proceed with caution. While the trend remains bullish, the momentum and volume indicators suggest a possible reversal or consolidation. The increased volatility adds another layer of uncertainty to the stock's movement. Investors should closely monitor the price action and wait for clearer signals before making any significant trading decisions.