Technical Analysis of DARP 2024-05-10
Overview:
In analyzing the provided Technical Analysis (TA) data for the stock over the last 5 days, we will delve into the trend, momentum, volatility, and volume indicators to forecast the possible stock price movement in the upcoming days. By examining these key indicators, we aim to provide a comprehensive and insightful prediction for the stock's future price direction.
Trend Analysis:
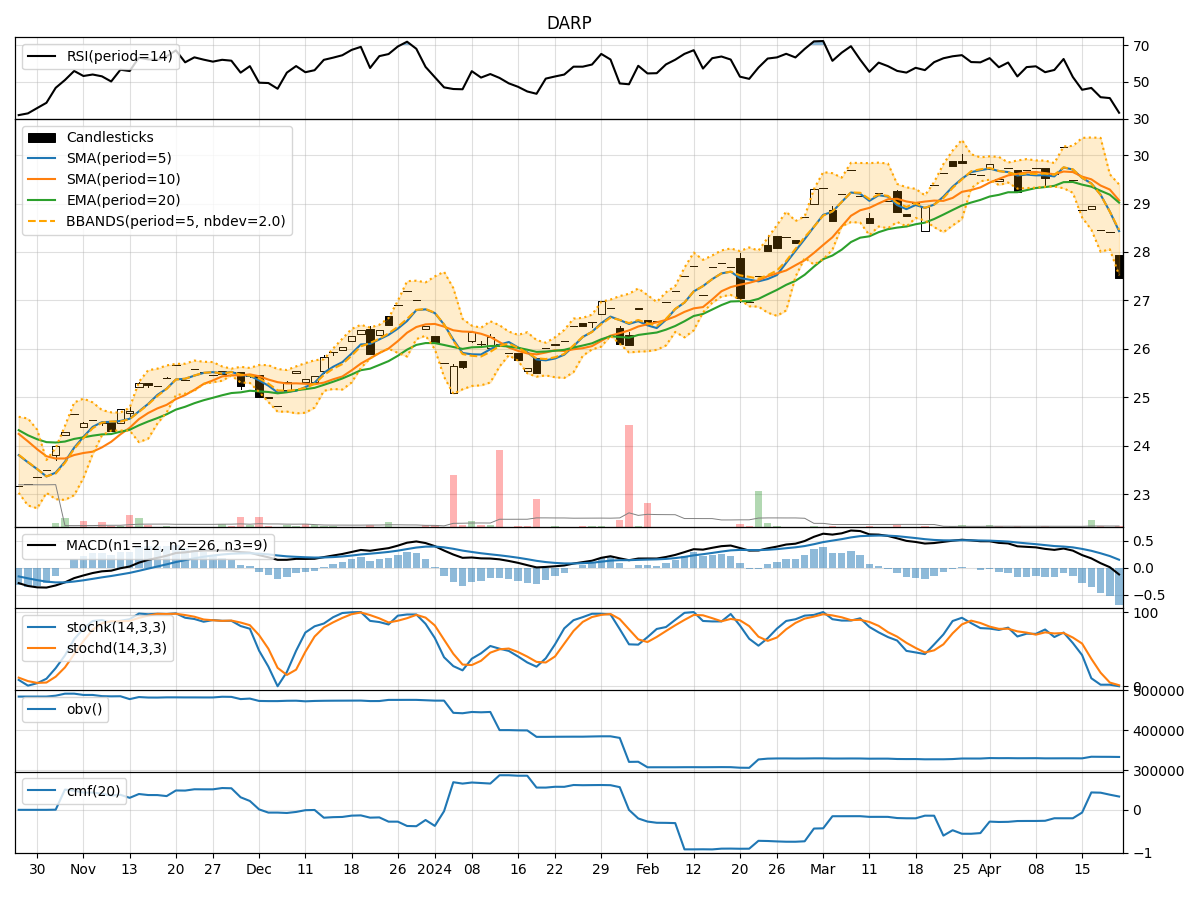
- Moving Averages (MA): The stock's closing prices have been consistently above the 5-day Moving Average (MA), indicating a bullish trend.
- MACD: The Moving Average Convergence Divergence (MACD) has been positive, suggesting upward momentum in the stock price.
- EMA: The Exponential Moving Average (EMA) has been trending upwards, supporting the bullish sentiment in the short to medium term.
Momentum Analysis:
- RSI: The Relative Strength Index (RSI) has been hovering around the neutral zone, indicating a balanced momentum in the stock.
- Stochastic Oscillator: Both %K and %D values have been declining, signaling a potential reversal in momentum.
- Williams %R: The Williams %R indicator is in the oversold territory, suggesting a possible upcoming bullish reversal.
Volatility Analysis:
- Bollinger Bands: The Bollinger Bands are narrowing, indicating decreasing volatility and a potential period of consolidation.
- Bollinger %B: The %B value is relatively low, suggesting the stock is trading near the lower band, potentially indicating an oversold condition.
Volume Analysis:
- On-Balance Volume (OBV): The OBV has been relatively stable, indicating a balance between buying and selling pressure.
- Chaikin Money Flow (CMF): The CMF has been positive, suggesting that money is flowing into the stock.
Key Observations and Opinions:
- Trend: The stock is currently in an upward trend supported by moving averages and MACD.
- Momentum: Momentum indicators show a mixed signal, with RSI neutral, Stochastic indicating a potential reversal, and Williams %R in oversold territory.
- Volatility: Volatility is decreasing, indicating a possible period of consolidation.
- Volume: Volume indicators suggest a balanced market sentiment with money flowing into the stock.
Conclusion:
Based on the analysis of the technical indicators, the stock is likely to experience consolidation in the upcoming days, with a potential for a bullish reversal in momentum. Traders should monitor the Stochastic oscillator for a confirmation of the reversal and consider the narrowing Bollinger Bands as a signal of reduced volatility. Overall, the stock shows signs of potential upward movement in the near future.