Technical Analysis of DAT 2024-05-10
Overview:
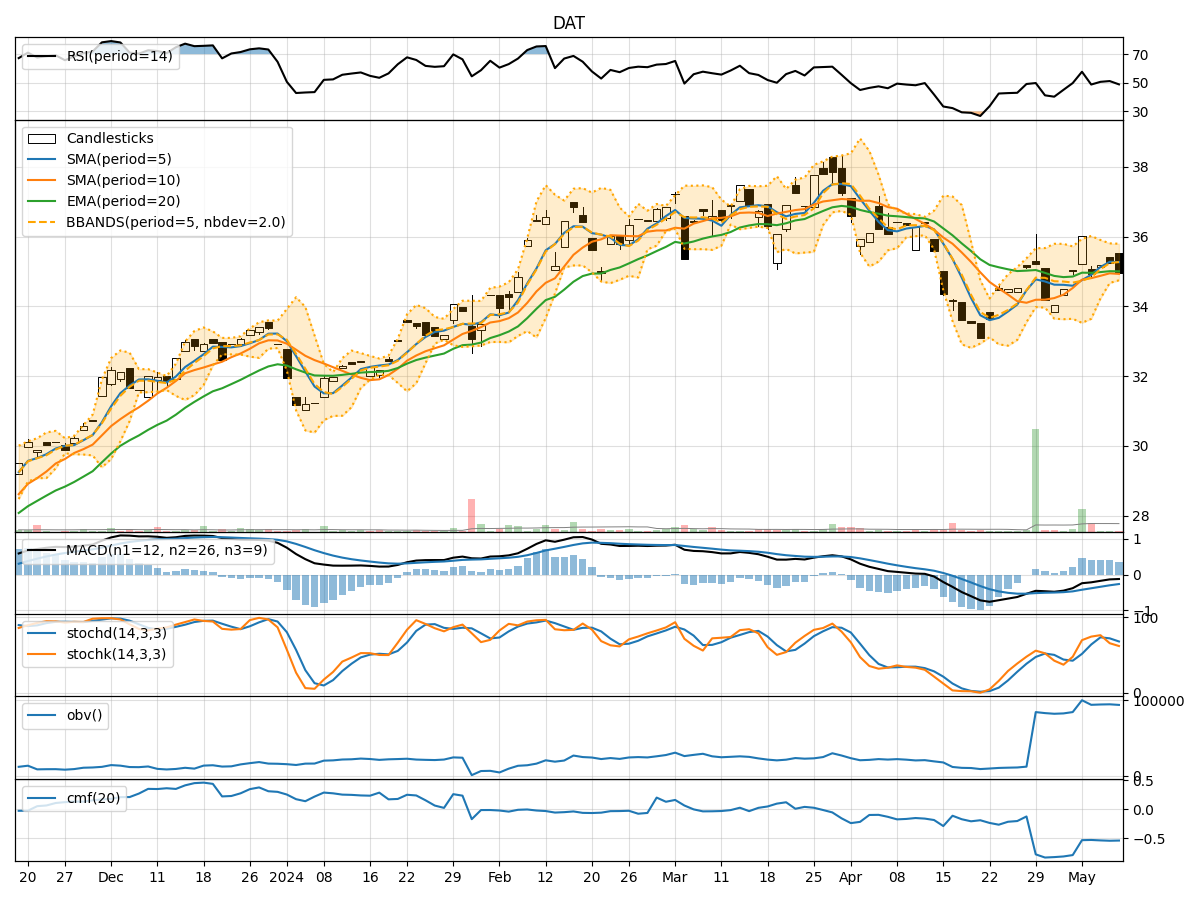
In the last 5 trading days, the stock price of DAT has shown some fluctuations with varying volumes. The technical indicators provide insights into the trend, momentum, volatility, and volume of the stock. By analyzing these indicators, we can make informed predictions about the possible future movements of the stock price.
Trend Analysis:
- Moving Averages (MA): The 5-day Moving Average (MA) has been fluctuating around the Simple Moving Average (SMA) and Exponential Moving Average (EMA) values. This indicates a lack of clear trend direction.
- MACD: The Moving Average Convergence Divergence (MACD) has been negative, suggesting a bearish momentum in the short term.
- MACD Histogram: The MACD Histogram has been positive, indicating a potential reversal in the bearish momentum.
Momentum Analysis:
- RSI: The Relative Strength Index (RSI) has been fluctuating around the 50 level, indicating a neutral momentum.
- Stochastic Oscillator: Both %K and %D values of the Stochastic Oscillator have been decreasing, suggesting a bearish momentum.
- Williams %R: The Williams %R indicator has been in the oversold territory, indicating a potential reversal in the short term.
Volatility Analysis:
- Bollinger Bands: The Bollinger Bands have been narrowing, indicating decreasing volatility in the stock price.
- Bollinger %B: The %B value has been decreasing, suggesting a potential consolidation phase.
Volume Analysis:
- On-Balance Volume (OBV): The OBV has been fluctuating, indicating mixed buying and selling pressure.
- Chaikin Money Flow (CMF): The CMF has been negative, suggesting a bearish money flow in the stock.
Conclusion:
Based on the analysis of the technical indicators: - Trend: The stock is currently in a sideways trend with no clear direction. - Momentum: The momentum indicators suggest a bearish sentiment in the short term. - Volatility: The decreasing volatility and %B values indicate a possible consolidation phase. - Volume: The mixed OBV and negative CMF point towards a bearish sentiment.
Overall View:
Considering the technical indicators and the current market dynamics, the next few days' possible stock price movement for DAT is likely to be sideways with a bearish bias. Traders and investors should exercise caution and consider waiting for a clearer trend to emerge before making significant trading decisions.