Technical Analysis of DAUG 2024-05-10
Overview:
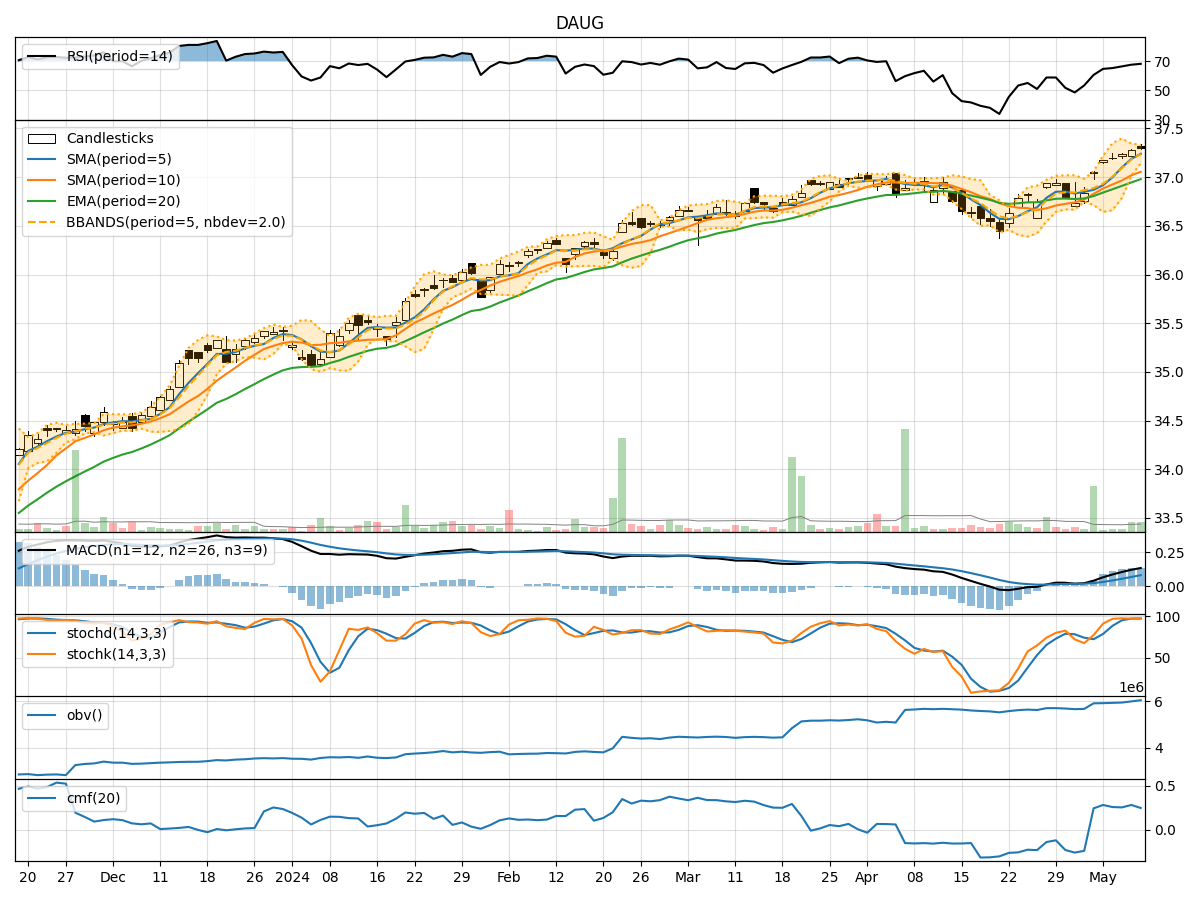
In analyzing the technical indicators for DAUG stock over the last 5 days, we will delve into the trends, momentum, volatility, and volume aspects to provide a comprehensive outlook on the possible stock price movement in the coming days. By examining key indicators such as moving averages, MACD, RSI, Bollinger Bands, and OBV, we aim to offer valuable insights and predictions for potential price action.
Trend Analysis:
- Moving Averages (MA): The 5-day MA has been consistently above the closing prices, indicating a bullish trend.
- MACD: The MACD line has been above the signal line, suggesting a positive momentum in the stock price.
Momentum Analysis:
- RSI: The RSI has been trending upwards, indicating increasing buying pressure.
- Stochastic Oscillator: Both %K and %D have been in overbought territory, signaling a strong bullish momentum.
Volatility Analysis:
- Bollinger Bands: The stock price has been trading within the bands, showing moderate volatility.
Volume Analysis:
- On-Balance Volume (OBV): The OBV has been steadily increasing, reflecting accumulation by investors.
Key Observations:
- The stock is in an upward trend supported by moving averages and MACD.
- Momentum indicators like RSI and Stochastic Oscillator suggest strong buying pressure.
- Volatility remains moderate based on Bollinger Bands.
- Increasing OBV indicates positive volume accumulation.
Conclusion:
Based on the analysis of technical indicators, the next few days for DAUG stock are likely to see a continuation of the bullish trend. The momentum is strong, supported by increasing buying pressure and positive volume accumulation. Therefore, the stock price is expected to rise in the coming days. Traders and investors may consider buying opportunities in line with the current uptrend.