Technical Analysis of DBA 2024-05-10
Overview:
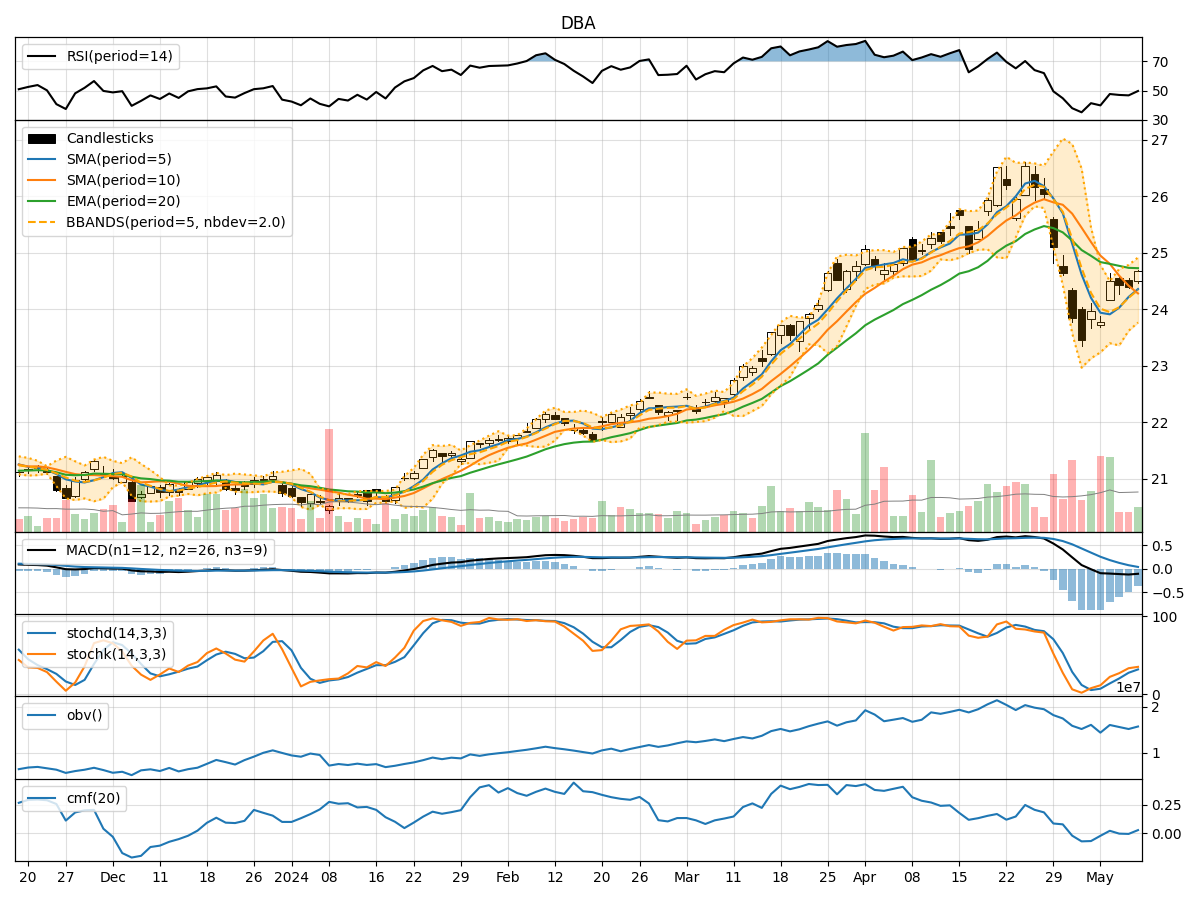
In the last 5 trading days, DBA stock has shown mixed signals across various technical indicators. The trend indicators suggest a slightly bearish sentiment, with the moving averages and MACD showing a downward trend. Momentum indicators are neutral to slightly bearish, while volatility indicators indicate a narrowing of the Bollinger Bands. Volume indicators show a slight increase in On-Balance Volume (OBV) but a negative Chaikin Money Flow (CMF).
Trend Indicators:
- Moving Averages (MA): The 5-day MA is below the 10-day SMA, indicating a short-term bearish trend.
- MACD: The MACD line is below the signal line, suggesting a bearish momentum.
- EMA: The EMA is also trending downwards, reflecting a bearish sentiment.
Key Observation: The trend indicators collectively point towards a bearish outlook for DBA stock in the short term.
Momentum Indicators:
- RSI: The RSI is below 50, indicating a neutral to slightly bearish momentum.
- Stochastic Oscillator: Both %K and %D are below 50, suggesting a bearish momentum.
- Williams %R: The indicator is in oversold territory, indicating a potential reversal.
Key Observation: Momentum indicators are signaling a bearish sentiment for DBA stock.
Volatility Indicators:
- Bollinger Bands (BB): The bands are narrowing, suggesting decreasing volatility.
- Bollinger %B: The %B is below 1, indicating a potential oversold condition.
Key Observation: Volatility indicators show a decreasing volatility environment for DBA stock.
Volume Indicators:
- On-Balance Volume (OBV): The OBV has shown a slight increase, indicating some buying pressure.
- Chaikin Money Flow (CMF): The CMF is negative, suggesting a bearish money flow.
Key Observation: Volume indicators are mixed, with OBV showing slight buying pressure but CMF indicating a bearish money flow.
Conclusion:
Based on the analysis of trend, momentum, volatility, and volume indicators, the overall outlook for DBA stock in the next few days is bearish. The trend indicators, momentum indicators, and volume indicators collectively suggest a downward movement in the stock price. The narrowing Bollinger Bands indicate decreasing volatility, which may lead to a consolidation phase before a potential further downward movement.
Key Conclusion: The next few days are likely to see a downward movement in DBA stock price. Investors should exercise caution and consider potential shorting opportunities or wait for a clearer signal before entering a long position.