Technical Analysis of DBC 2024-05-10
Overview:
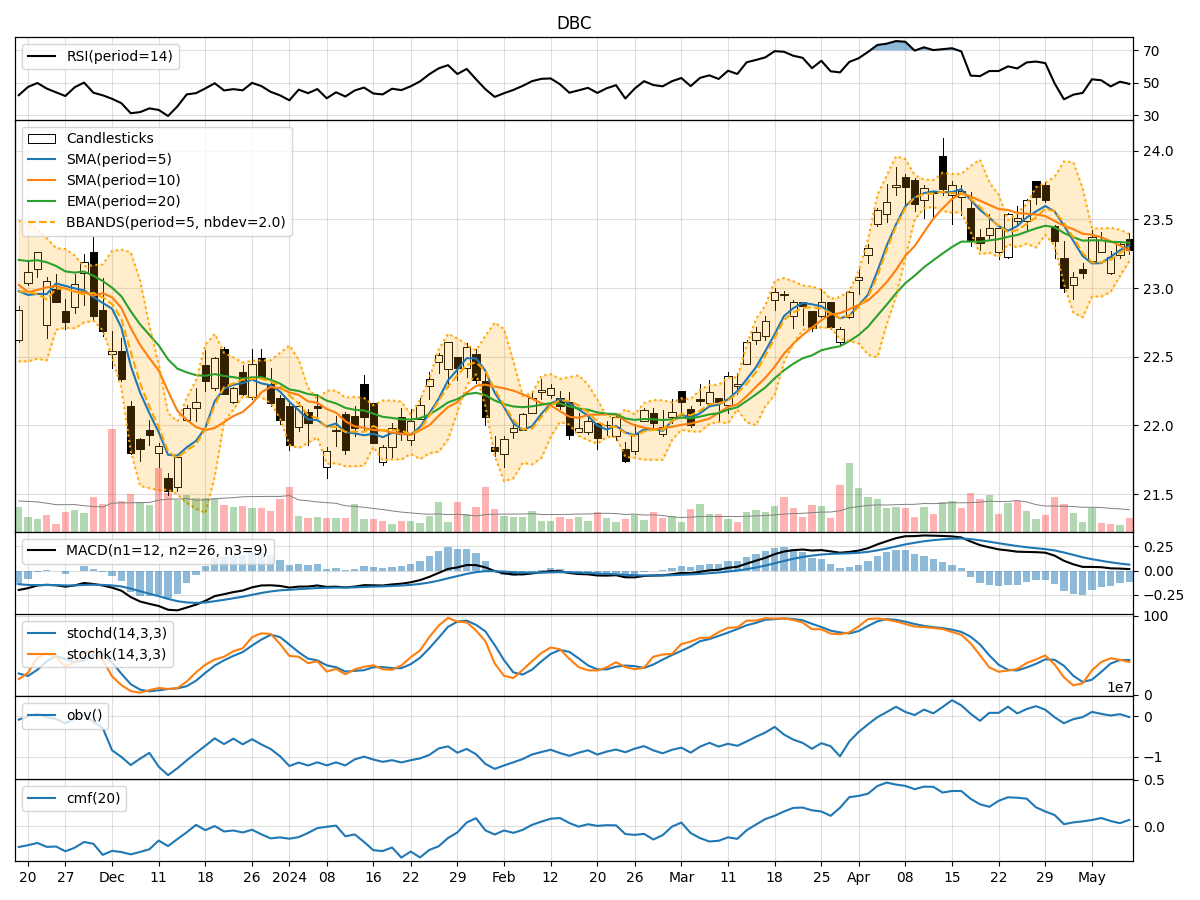
In analyzing the technical indicators for DBC over the last 5 days, we will delve into the trend, momentum, volatility, and volume indicators to provide a comprehensive outlook on the possible stock price movement in the coming days.
Trend Analysis:
- Moving Averages (MA): The 5-day MA has been fluctuating around the closing prices, indicating short-term price trends. The SMA(10) and EMA(20) have shown a slight decline, suggesting a weakening trend.
- MACD: The MACD line has been positive but decreasing, while the MACD Histogram has been negative, indicating a potential bearish crossover.
- Conclusion: The trend indicators suggest a bearish sentiment in the short term.
Momentum Analysis:
- RSI: The RSI has been hovering around the neutral zone, indicating a lack of strong momentum.
- Stochastic Oscillator: Both %K and %D have been declining, signaling a potential reversal in momentum.
- Williams %R: The indicator has been in the oversold region, suggesting a possible bounce-back.
- Conclusion: The momentum indicators point towards a neutral to slightly bearish momentum.
Volatility Analysis:
- Bollinger Bands (BB): The bands have been narrowing, indicating decreasing volatility.
- Conclusion: Volatility has been decreasing, which could lead to a period of consolidation or a potential breakout.
Volume Analysis:
- On-Balance Volume (OBV): The OBV has been fluctuating, indicating mixed buying and selling pressure.
- Chaikin Money Flow (CMF): The CMF has been relatively low, suggesting a lack of strong buying or selling pressure.
- Conclusion: Volume indicators reflect a neutral sentiment with no clear direction.
Overall Conclusion:
Based on the analysis of trend, momentum, volatility, and volume indicators, the next few days' possible stock price movement for DBC is likely to be sideways with a bearish bias. The trend indicators signal a bearish sentiment, while momentum remains neutral to slightly bearish. Decreasing volatility may lead to consolidation, supported by neutral volume indicators.
Key Recommendations:
- Monitor Price Action: Keep a close eye on how the stock reacts to key support and resistance levels.
- Wait for Confirmation: Look for a clear breakout or breakdown from the current consolidation phase before making significant trading decisions.
- Consider Risk Management: Implement stop-loss orders to protect against unexpected price movements.
- Stay Informed: Continuously monitor market news and updates that could impact DBC's price movement.
Disclaimer:
Remember that market conditions can change rapidly, and unexpected events may influence stock prices. It's crucial to conduct your own research and consider multiple factors before making any investment decisions. Consulting with a financial advisor can provide personalized insights tailored to your specific investment goals and risk tolerance level.