Technical Analysis of DBEH 2024-05-10
Overview:
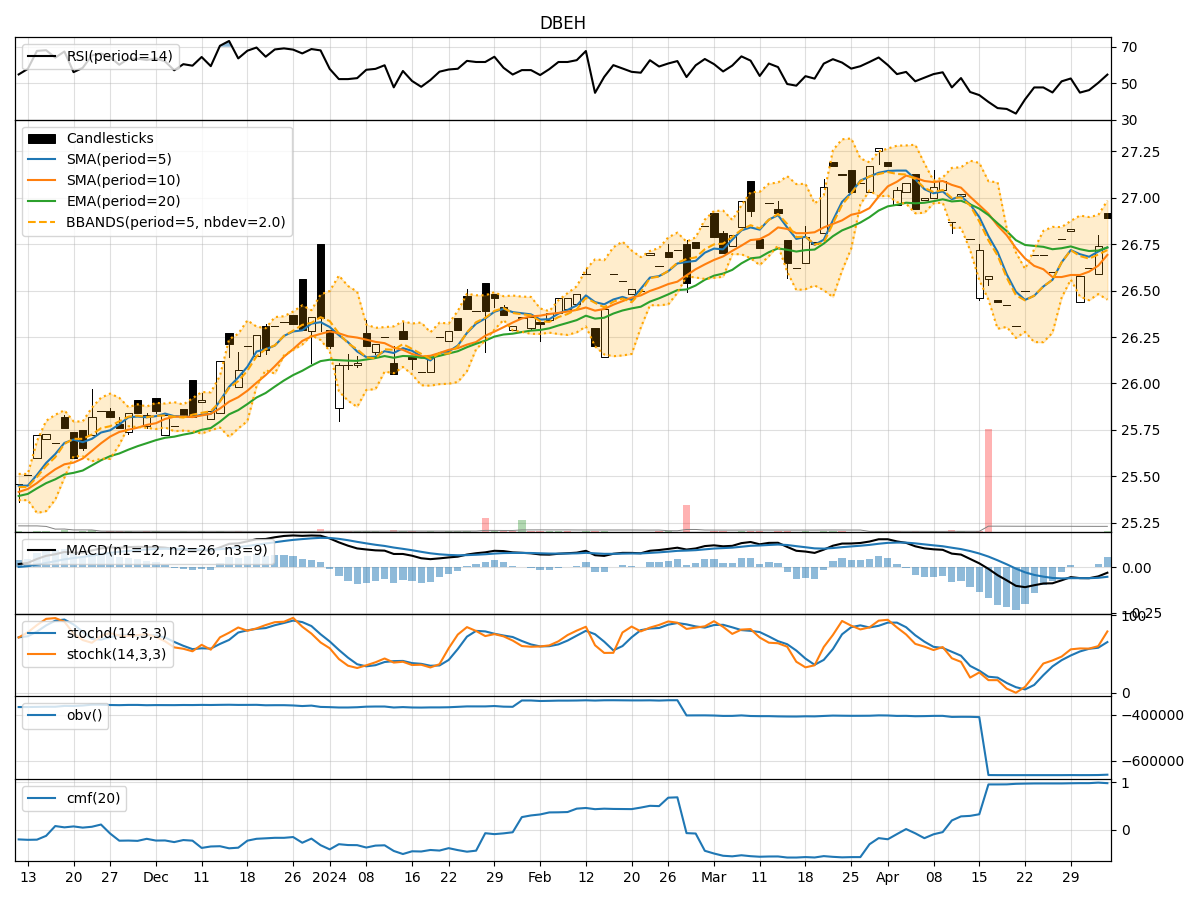
In analyzing the technical indicators for DBEH over the last 5 days, we will delve into the trend, momentum, volatility, and volume indicators to provide a comprehensive outlook on the possible stock price movement in the coming days. By examining these key aspects, we aim to offer valuable insights and predictions to guide your investment decisions.
Trend Analysis:
- Moving Averages (MA): The 5-day MA has been consistently above the closing prices, indicating an upward trend. This suggests that the stock price has been trending higher over the past few days.
- MACD: The MACD line has been above the signal line, with both lines showing a positive trend. This signals bullish momentum in the stock price.
- RSI: The RSI value has been fluctuating around the 60-65 range, indicating moderate bullish momentum in the stock.
Momentum Analysis:
- Stochastic Oscillator: Both %K and %D lines of the Stochastic Oscillator have been consistently high, suggesting that the stock is in overbought territory.
- Williams %R: The Williams %R indicator has been hovering around 0, indicating that the stock is close to overbought levels.
Volatility Analysis:
- Bollinger Bands (BB): The stock price has been trading within the Bollinger Bands, with the bands narrowing over the past few days. This suggests a decrease in volatility and a possible period of consolidation.
- Average True Range (ATR): The ATR value has been decreasing, indicating a reduction in price volatility.
Volume Analysis:
- On-Balance Volume (OBV): The OBV has been slightly negative, indicating selling pressure in the stock.
- Chaikin Money Flow (CMF): The CMF value has been decreasing, suggesting outflow of money from the stock.
Conclusion:
Based on the analysis of the technical indicators, the next few days' possible stock price movement for DBEH is likely to experience consolidation or a sideways trend. The stock has shown signs of bullish momentum in the trend and momentum indicators, but the overbought levels in the Stochastic Oscillator and Williams %R, coupled with decreasing volume indicators, indicate a potential slowdown in price movement.
Key Conclusion: The stock is likely to trade sideways in the near term, with a possible consolidation phase. It is advisable to closely monitor the price action and key support/resistance levels for potential entry or exit points.
Remember, market dynamics can change rapidly, so it's essential to stay updated with real-time data and adjust your strategy accordingly.