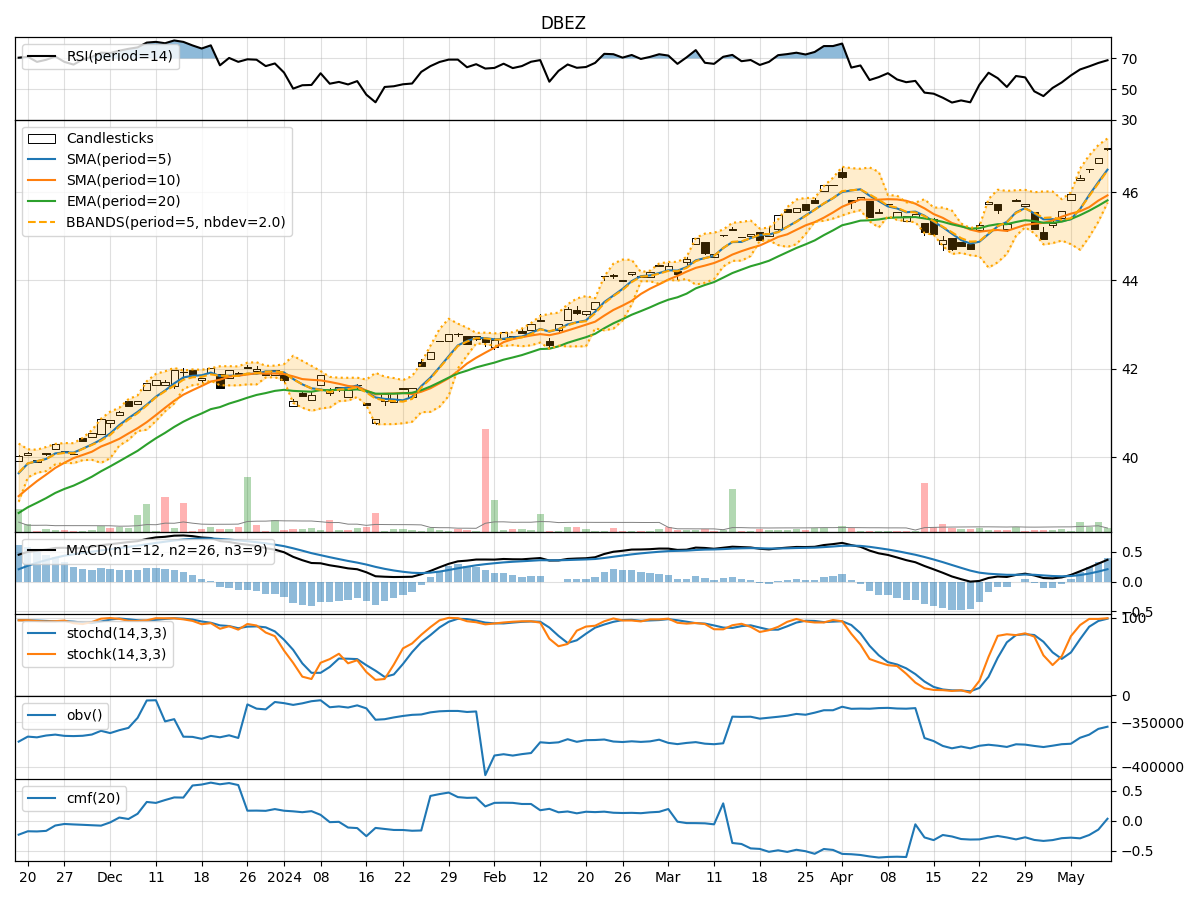
Technical Analysis of DBEZ 2024-05-10
Overview:
In the last 5 trading days, DBEZ stock has shown a consistent uptrend in both price and volume. The moving averages (MA) have been trending upwards, with the 5-day MA consistently above the 10-day simple moving average (SMA). The MACD indicator has been positive and increasing, indicating bullish momentum. The Relative Strength Index (RSI) and Stochastic indicators are in overbought territory, suggesting a potential pullback. The Bollinger Bands have been expanding, indicating increased volatility. On-balance volume (OBV) has been rising, showing accumulation by investors.
Trend Indicators Analysis:
- The moving averages (MA) are trending upwards, indicating a bullish trend.
- The MACD line is above the signal line, showing positive momentum.
- The MACD histogram is increasing, suggesting strengthening bullish momentum.
- Overall, the trend indicators point towards an upward trend in the stock price.
Momentum Indicators Analysis:
- The RSI is in overbought territory, signaling a potential reversal or pullback.
- The Stochastic indicators are also in overbought territory, indicating a possible short-term reversal.
- The Williams %R indicator is close to oversold levels, suggesting a potential buying opportunity.
- Momentum indicators suggest a potential short-term pullback in the stock price.
Volatility Indicators Analysis:
- The Bollinger Bands have been expanding, indicating increased volatility.
- The upper Bollinger Band (BBU) and lower Bollinger Band (BBL) are widening, suggesting potential price swings.
- The Bollinger Band %B (BBP) is above 0.8, indicating the stock is in an overbought condition.
- Volatility indicators suggest increased volatility in the stock price.
Volume Indicators Analysis:
- On-balance volume (OBV) has been steadily increasing, indicating accumulation by investors.
- The Chaikin Money Flow (CMF) is negative but improving, suggesting buying pressure is increasing.
- Volume indicators suggest positive accumulation in the stock.
Conclusion:
Based on the analysis of trend, momentum, volatility, and volume indicators, the next few days' possible stock price movement for DBEZ is likely to experience a short-term pullback due to overbought conditions indicated by the RSI and Stochastic indicators. However, the overall trend remains bullish, supported by the positive momentum and increasing volume accumulation. Traders may consider taking profits or waiting for a better entry point during the anticipated pullback. Exercise caution and consider potential profit-taking strategies in the short term.