Technical Analysis of DBND 2024-05-10
Overview:
In analyzing the technical indicators for DBND over the last 5 days, we will delve into the trend, momentum, volatility, and volume indicators to provide a comprehensive outlook on the possible stock price movement. By examining these key factors, we aim to offer valuable insights and predictions for the upcoming days.
Trend Analysis:
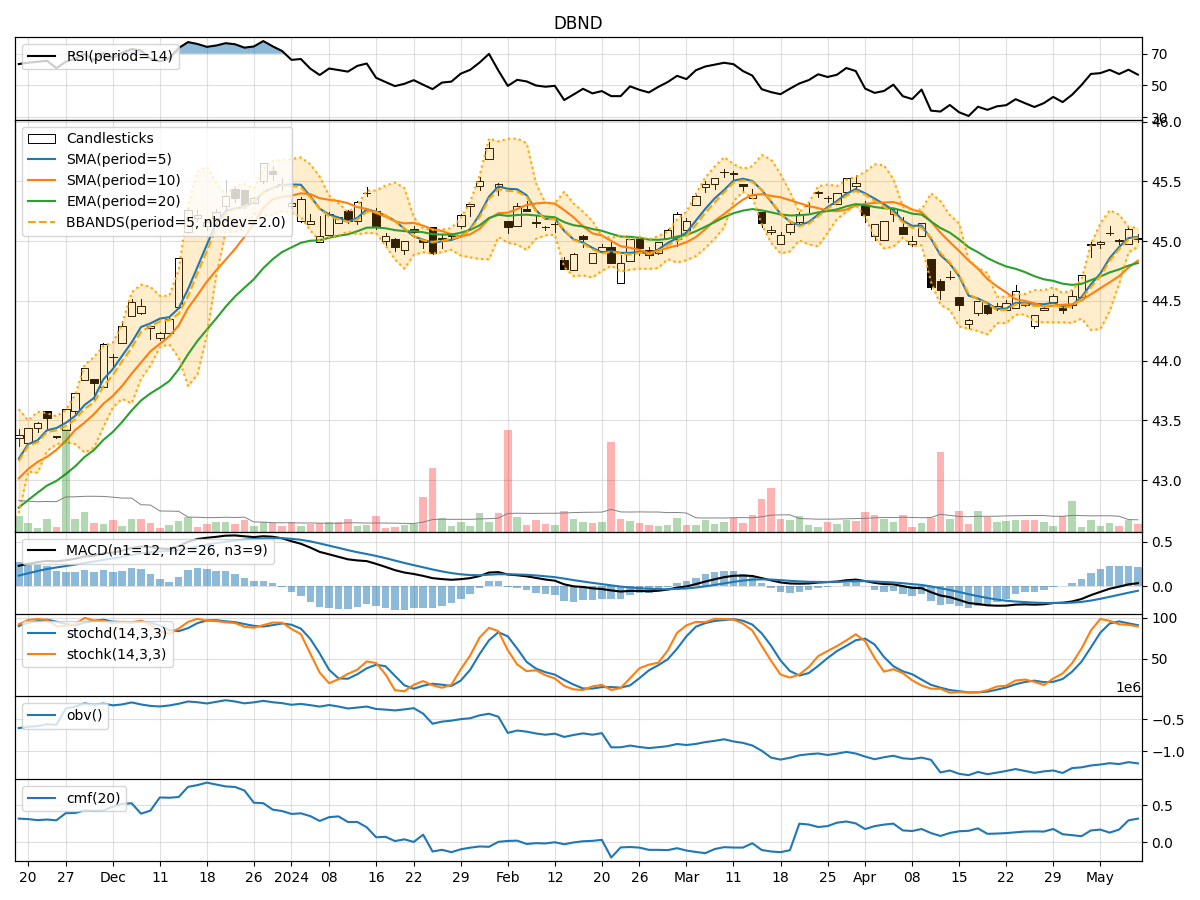
- Moving Averages (MA): The 5-day Moving Average (MA) has been consistently above the Simple Moving Average (SMA) and Exponential Moving Average (EMA), indicating a short-term uptrend.
- MACD: The MACD line has been positive and above the signal line, suggesting bullish momentum in the stock price.
- RSI: The Relative Strength Index (RSI) has been fluctuating around the 50 level, indicating a neutral stance in terms of momentum.
Momentum Analysis:
- Stochastic Oscillator: The Stochastic Oscillator has been hovering in the overbought territory, suggesting a potential reversal or consolidation phase.
- Williams %R: The Williams %R indicator has been showing oversold conditions, signaling a possible buying opportunity.
Volatility Analysis:
- Bollinger Bands (BB): The Bollinger Bands have been relatively narrow, indicating low volatility in the stock price movement.
- Average True Range (ATR): The ATR values have been decreasing, suggesting a decrease in price volatility.
Volume Analysis:
- On-Balance Volume (OBV): The OBV has been fluctuating, indicating mixed buying and selling pressure.
- Chaikin Money Flow (CMF): The CMF has been positive, suggesting a potential inflow of money into the stock.
Key Observations:
- The trend indicators point towards a short-term uptrend in the stock price.
- Momentum indicators show conflicting signals with the Stochastic Oscillator in overbought territory and Williams %R in oversold conditions.
- Volatility is relatively low, indicating a stable price movement.
- Volume indicators suggest mixed buying and selling pressure with a slight positive bias.
Conclusion:
Based on the analysis of the technical indicators, the stock price of DBND is likely to experience sideways consolidation in the upcoming days. The conflicting signals from momentum indicators and the stable volatility suggest a period of indecision in the market. Traders may consider waiting for clearer signals before making significant trading decisions.