Technical Analysis of DBO 2024-05-10
Overview:
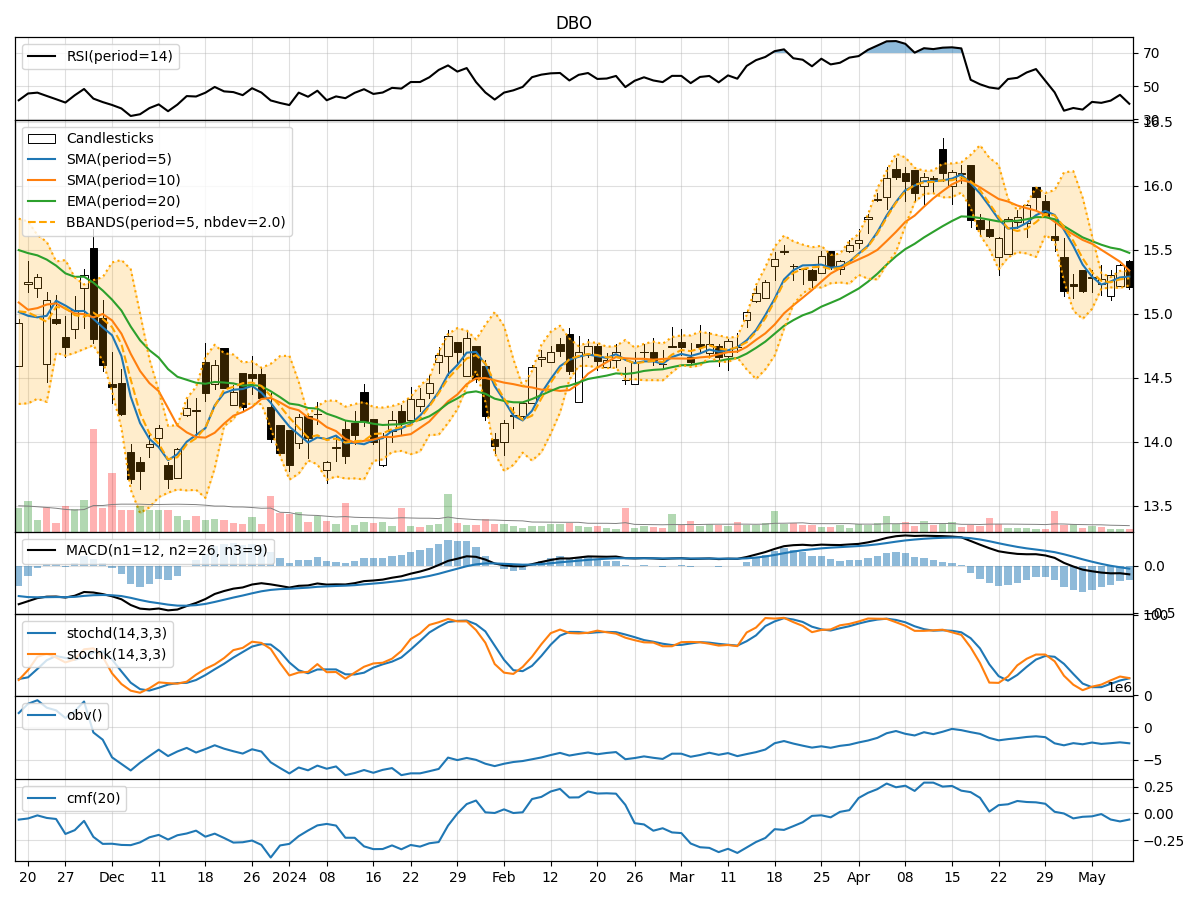
In analyzing the technical indicators for DBO over the last 5 days, we will delve into the trend, momentum, volatility, and volume indicators to provide a comprehensive outlook on the possible stock price movement in the coming days. By examining these key aspects, we aim to offer valuable insights and predictions to guide your investment decisions.
Trend Analysis:
- Moving Averages (MA): The 5-day MA has been relatively stable around the closing prices, indicating a short-term trend. However, it is below both the SMA(10) and EMA(20), suggesting a potential bearish sentiment.
- MACD: The MACD line has been consistently negative, with the MACD histogram also showing a downward trend. This indicates a bearish momentum in the stock price.
- Conclusion: The trend indicators point towards a bearish outlook for DBO in the near term.
Momentum Analysis:
- RSI: The RSI values have been fluctuating around the mid-level, indicating indecision in the market sentiment.
- Stochastic Oscillator: Both %K and %D values have shown mixed movements, with %K hovering around the overbought territory.
- Conclusion: The momentum indicators suggest a neutral stance with no clear direction in the stock price movement.
Volatility Analysis:
- Bollinger Bands (BB): The stock price has been trading within the Bollinger Bands, with the bands narrowing in recent days. This signifies decreasing volatility.
- Conclusion: Volatility indicators signal a consolidation phase with a potential decrease in price fluctuations.
Volume Analysis:
- On-Balance Volume (OBV): The OBV values have shown slight fluctuations but have not exhibited a clear trend.
- Chaikin Money Flow (CMF): The CMF values have been negative, indicating selling pressure in the stock.
- Conclusion: Volume indicators suggest a neutral to bearish sentiment in terms of market participation.
Overall Conclusion:
Based on the analysis of trend, momentum, volatility, and volume indicators, the overall outlook for DBO in the next few days leans towards a bearish sentiment. The trend indicators indicate a downward trajectory, supported by the negative MACD and bearish moving averages. Momentum indicators show a lack of clear direction, while volatility signals a consolidation phase with decreasing price fluctuations. Volume indicators also point towards a neutral to bearish sentiment in market participation.
Recommendation:
Considering the collective analysis of technical indicators, it is advisable to exercise caution when trading DBO in the coming days. Investors may consider adopting a wait-and-see approach or implementing risk management strategies to navigate the potential downside risk. It is crucial to monitor the evolving market dynamics closely and adjust investment strategies accordingly to mitigate risks and capitalize on opportunities.