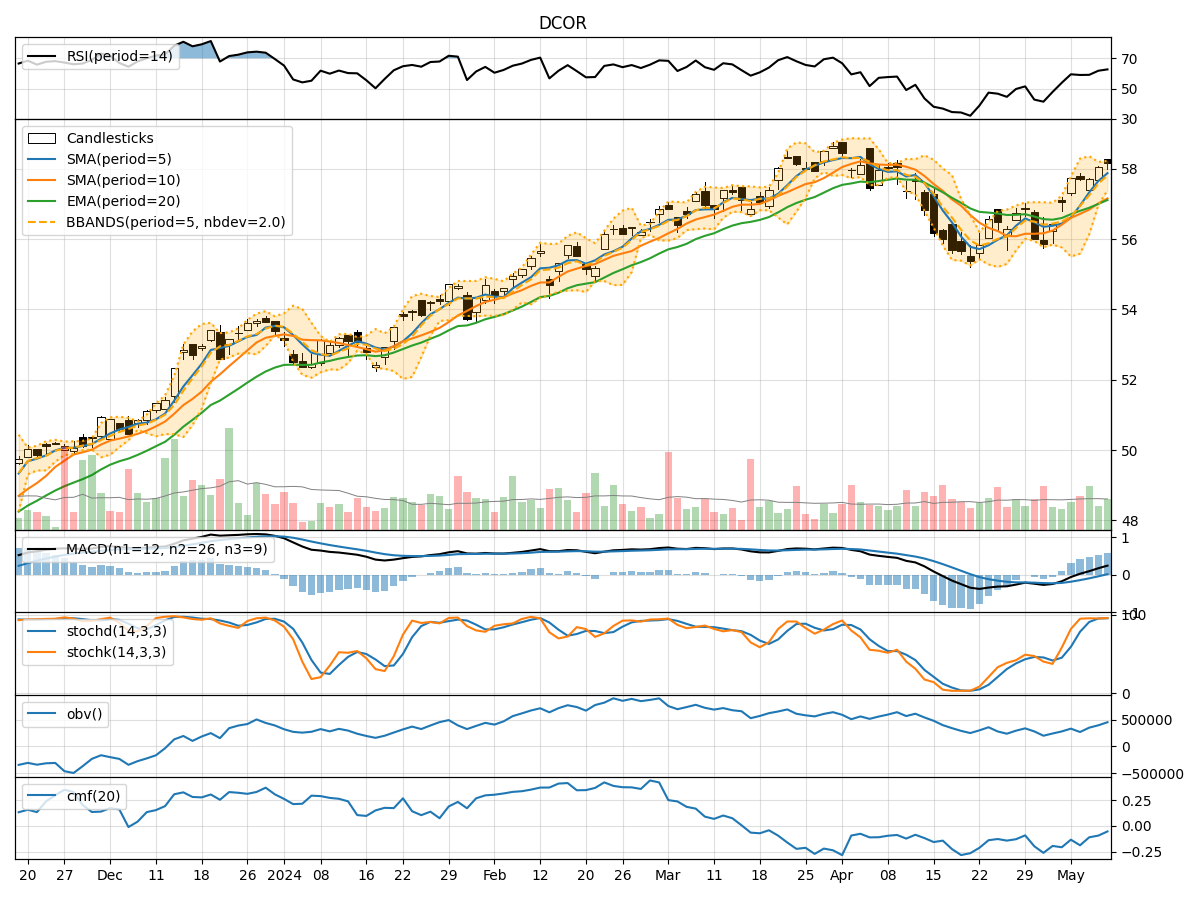
Technical Analysis of DCOR 2024-05-10
Overview:
In analyzing the technical indicators for DCOR over the last 5 days, we will delve into the trend, momentum, volatility, and volume indicators to provide a comprehensive outlook on the possible stock price movement in the coming days.
Trend Analysis:
- Moving Averages (MA): The 5-day Moving Average has been consistently above the Simple Moving Average (SMA) and Exponential Moving Average (EMA), indicating a bullish trend.
- MACD: The MACD line has been consistently above the signal line, with the MACD histogram showing an increasing positive trend, suggesting bullish momentum.
Momentum Analysis:
- RSI: The Relative Strength Index (RSI) has been trending upwards and is currently in the overbought territory, indicating strong buying momentum.
- Stochastic Oscillator: Both %K and %D lines of the Stochastic Oscillator are in the overbought zone, suggesting a potential reversal or consolidation.
- Williams %R: The Williams %R is also in the overbought region, signaling a possible pullback.
Volatility Analysis:
- Bollinger Bands (BB): The stock price has been consistently trading above the middle Bollinger Band (BBM), indicating an uptrend. The bands are narrowing, suggesting a potential decrease in volatility.
- Bollinger %B: The %B indicator is above 0.8, indicating that the stock is trading near the upper band, potentially overbought.
Volume Analysis:
- On-Balance Volume (OBV): The OBV has been mostly negative over the last 5 days, indicating distribution and selling pressure.
- Chaikin Money Flow (CMF): The CMF has been negative, reflecting a lack of buying interest and potential weakness in the stock.
Conclusion:
Based on the analysis of the technical indicators, the stock of DCOR is currently exhibiting overbought conditions in terms of momentum indicators like RSI, Stochastic Oscillator, and Williams %R. The trend indicators, such as Moving Averages and MACD, suggest a bullish bias in the short term. However, the volatility indicators point towards a potential decrease in volatility and a consolidation phase.
Considering the mixed signals from the indicators, it is likely that DCOR may experience a short-term pullback or consolidation before potentially resuming its upward trend. Traders should exercise caution and consider waiting for a clearer signal before making any significant trading decisions.