Technical Analysis of DDEC 2024-05-10
Overview:
In analyzing the technical indicators for the stock based on the last 5 days of data, we will delve into the trend, momentum, volatility, and volume indicators to provide a comprehensive outlook on the possible stock price movement in the coming days. By examining these key indicators, we aim to offer valuable insights and predictions to guide your investment decisions.
Trend Indicators:
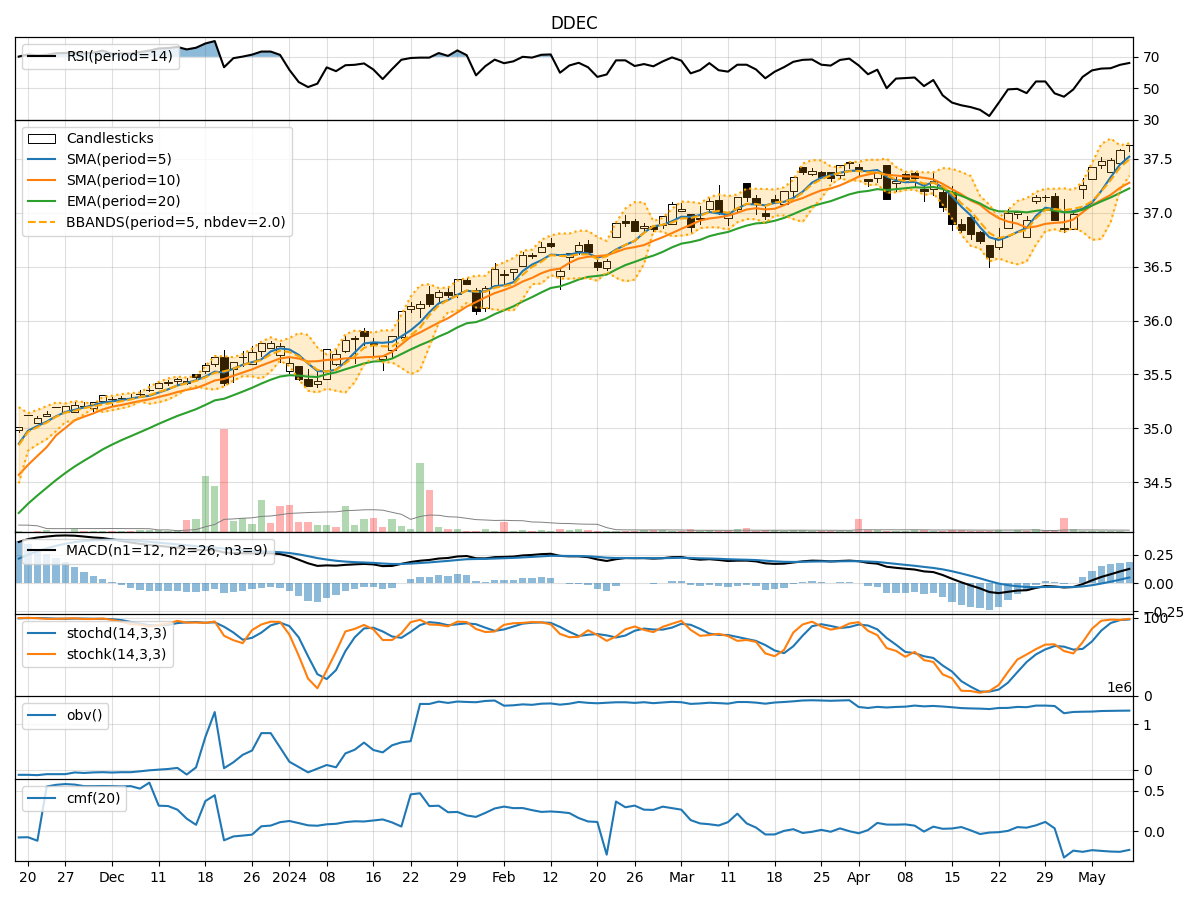
- Moving Averages (MA): The 5-day Moving Average (MA) has been consistently above the Simple Moving Average (SMA) and Exponential Moving Average (EMA), indicating a bullish trend.
- MACD: The MACD line has been consistently above the signal line, with both lines showing an upward trend, suggesting bullish momentum.
- MACD Histogram: The MACD Histogram has been increasing over the past 5 days, indicating strengthening bullish momentum.
Momentum Indicators:
- RSI: The Relative Strength Index (RSI) has been trending upwards and is currently in the overbought territory, suggesting a strong bullish momentum.
- Stochastic Oscillator: Both %K and %D lines of the Stochastic Oscillator are in the overbought zone, indicating a potential reversal or consolidation.
- Williams %R: The Williams %R is also in the overbought region, signaling a possible pullback in the stock price.
Volatility Indicators:
- Bollinger Bands: The Bollinger Bands are narrowing, indicating decreasing volatility and a potential period of consolidation.
- Bollinger %B: The %B indicator is above 0.8, suggesting that the stock is trading near the upper Bollinger Band, which could lead to a short-term reversal or consolidation.
Volume Indicators:
- On-Balance Volume (OBV): The OBV has been declining over the past 5 days, indicating selling pressure and potential bearish sentiment.
- Chaikin Money Flow (CMF): The CMF is negative, suggesting that money is flowing out of the stock, indicating bearish sentiment.
Conclusion:
Based on the analysis of the technical indicators, the stock is currently exhibiting strong bullish momentum in the short term. However, the overbought conditions in the RSI, Stochastic Oscillator, and Williams %R indicate a potential reversal or consolidation in the near future. The narrowing Bollinger Bands and declining OBV further support the possibility of a short-term pullback in the stock price.
Recommendation:
Given the current technical outlook, it is advisable to exercise caution and consider taking profits or implementing risk management strategies to protect gains. Traders may look for potential short-term selling opportunities or wait for a pullback to enter long positions at more favorable levels. Long-term investors should monitor the price action closely and wait for a clearer signal before making significant investment decisions.
Key Conclusion:
The stock is likely to experience a short-term pullback or consolidation after the recent bullish rally, presenting both trading opportunities and risks for investors.