Technical Analysis of DDIV 2024-05-10
Overview:
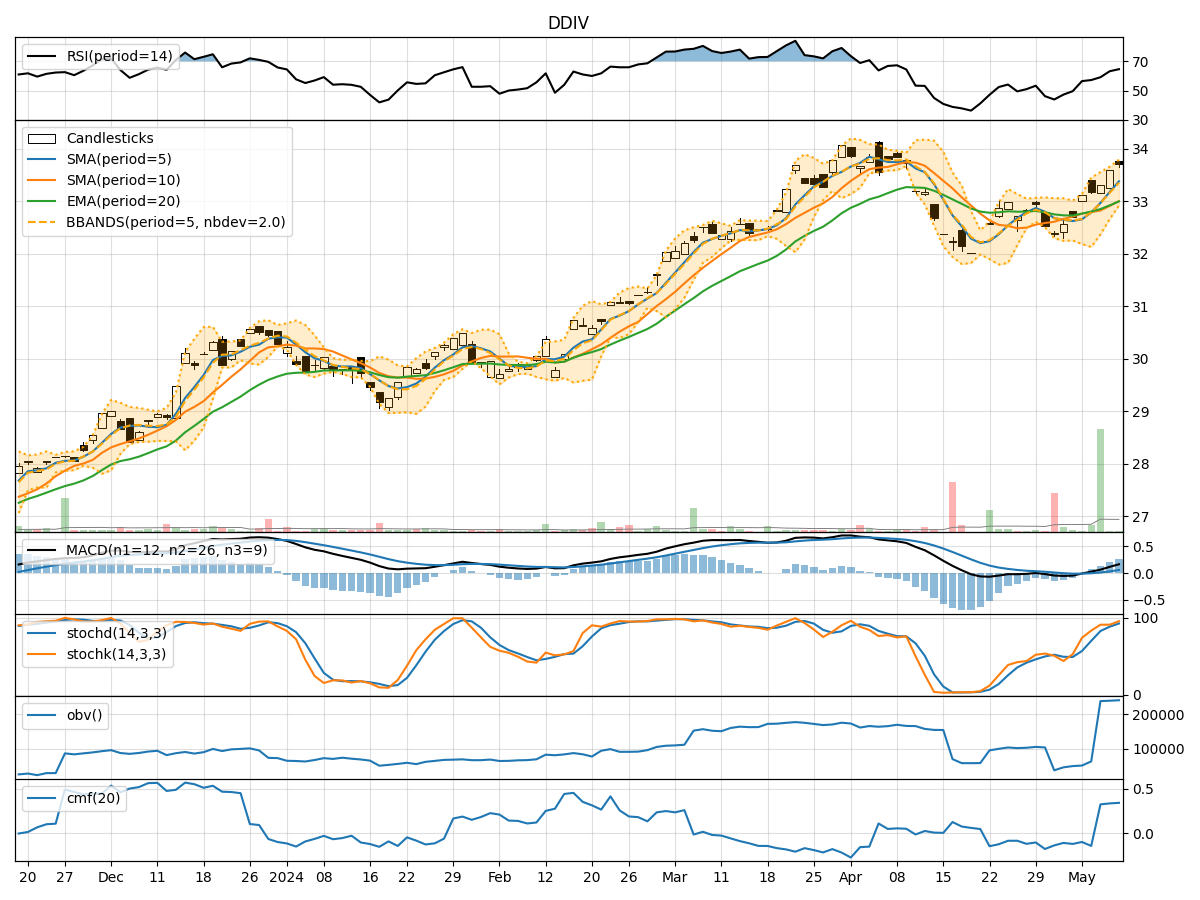
In analyzing the technical indicators for DDIV over the last 5 days, we will delve into the trend, momentum, volatility, and volume indicators to provide a comprehensive outlook on the possible stock price movement in the coming days.
Trend Analysis:
- Moving Averages (MA): The 5-day Moving Average (MA) has been consistently rising, indicating a bullish trend in the short term.
- MACD: The MACD line has been above the signal line, with both lines showing an upward trend, suggesting bullish momentum.
- EMA: The Exponential Moving Average (EMA) has been steadily increasing, supporting the bullish sentiment in the stock.
Momentum Analysis:
- RSI: The Relative Strength Index (RSI) has been trending upwards, indicating increasing buying pressure and potential for further price appreciation.
- Stochastic Oscillator: Both %K and %D lines of the Stochastic Oscillator have been in the overbought zone, suggesting a strong bullish momentum.
- Williams %R: The Williams %R is in the oversold territory, indicating a potential reversal to the upside.
Volatility Analysis:
- Bollinger Bands: The Bollinger Bands have been widening, indicating increased volatility in the stock price.
- Bollinger %B: The %B indicator has been fluctuating within a range, suggesting potential price reversals or breakouts.
Volume Analysis:
- On-Balance Volume (OBV): The OBV has been mostly positive, indicating accumulation by investors.
- Chaikin Money Flow (CMF): The CMF has been trending upwards, reflecting buying pressure and positive money flow into the stock.
Key Observations:
- The technical indicators collectively suggest a bullish outlook for DDIV in the near term.
- The trend indicators, momentum oscillators, and volume indicators all point towards a continuation of the current uptrend.
- The increasing moving averages, positive MACD, and rising RSI indicate a strong bullish sentiment in the stock.
- The expanding Bollinger Bands suggest that volatility is increasing, potentially leading to larger price movements.
Conclusion:
Based on the analysis of the technical indicators, the next few days for DDIV are likely to see further upward movement in the stock price. Investors may consider buying or holding positions in DDIV, as the indicators signal a continuation of the bullish trend. However, it is essential to monitor the price action closely and set appropriate stop-loss levels to manage risk effectively.