Technical Analysis of DDLS 2024-05-10
Overview:
In analyzing the technical indicators for DDLS over the last 5 days, we will delve into the trend, momentum, volatility, and volume indicators to provide a comprehensive outlook on the possible stock price movement. By examining these key aspects, we aim to offer valuable insights and predictions for the upcoming trading days.
Trend Analysis:
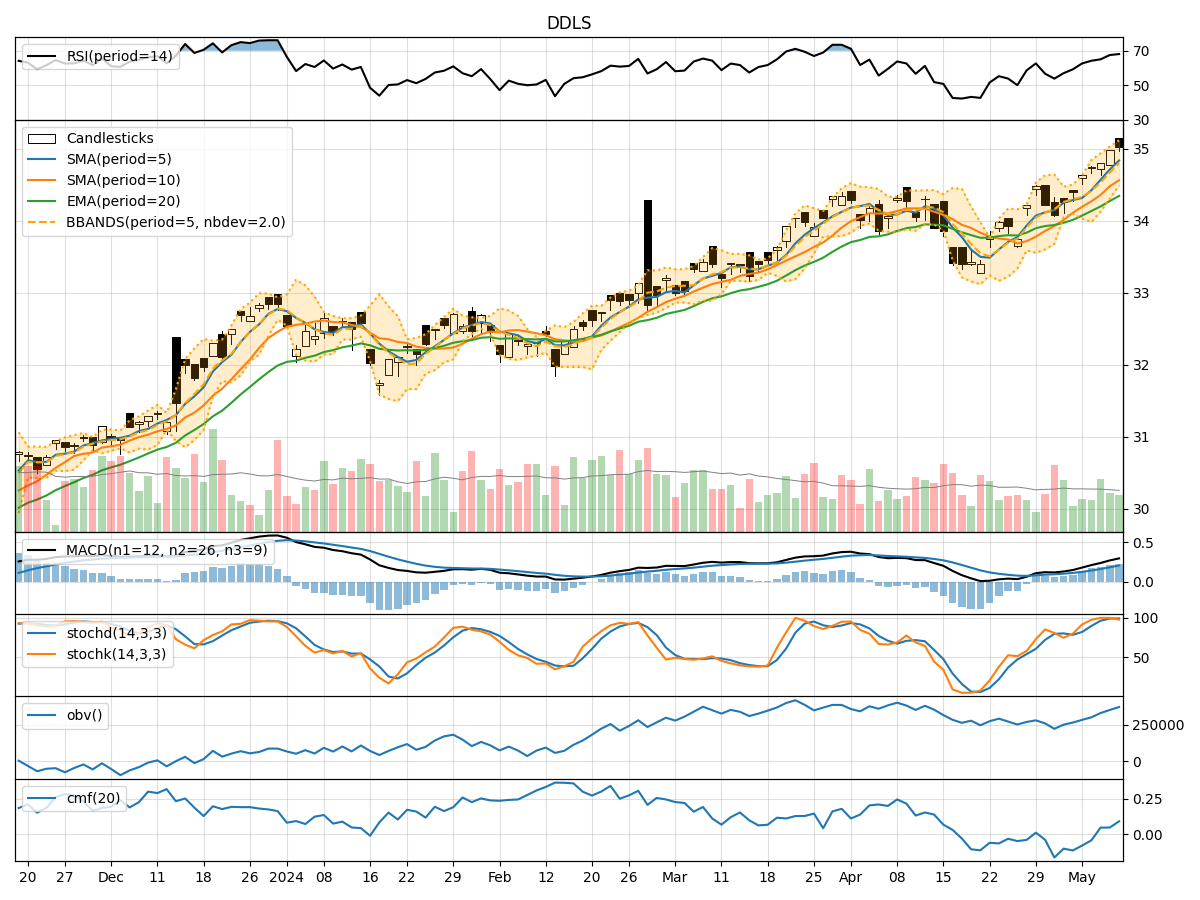
- Moving Averages (MA): The 5-day Moving Average (MA) has been consistently above the Simple Moving Average (SMA) and Exponential Moving Average (EMA), indicating a bullish trend.
- MACD: The MACD line has been above the signal line, with both lines showing an upward trend, suggesting positive momentum.
- MACD Histogram: The MACD Histogram has been increasing, indicating strengthening bullish momentum.
Momentum Analysis:
- RSI: The Relative Strength Index (RSI) has been trending upwards and is in the overbought territory, suggesting a potential pullback.
- Stochastic Oscillator: Both %K and %D lines of the Stochastic Oscillator have been in the overbought zone, indicating a possible reversal.
- Williams %R: The Williams %R is in the oversold region, signaling a potential buying opportunity.
Volatility Analysis:
- Bollinger Bands (BB): The stock price has been trading within the Bollinger Bands, with the bands narrowing, indicating reduced volatility.
- Bollinger %B: The %B indicator is below 1, suggesting the price is closer to the lower band, potentially indicating a buying opportunity.
Volume Analysis:
- On-Balance Volume (OBV): The OBV has been trending upwards, indicating accumulation by investors.
- Chaikin Money Flow (CMF): The CMF has been positive, reflecting buying pressure in the stock.
Conclusion:
Based on the analysis of the technical indicators, the next few days' possible stock price movement for DDLS could see a short-term pullback or consolidation. The overbought conditions in RSI and Stochastic Oscillator suggest a potential reversal or correction in the stock price. However, the bullish trend indicated by moving averages and MACD signals a resumption of the uptrend after a possible retracement.
Investors should closely monitor the price action around the key support levels and watch for any signs of reversal patterns. It is advisable to exercise caution and consider implementing risk management strategies in anticipation of a potential correction. Overall, the outlook remains bullish with a short-term cautionary bias.