Technical Analysis of DDWM 2024-05-10
Overview:
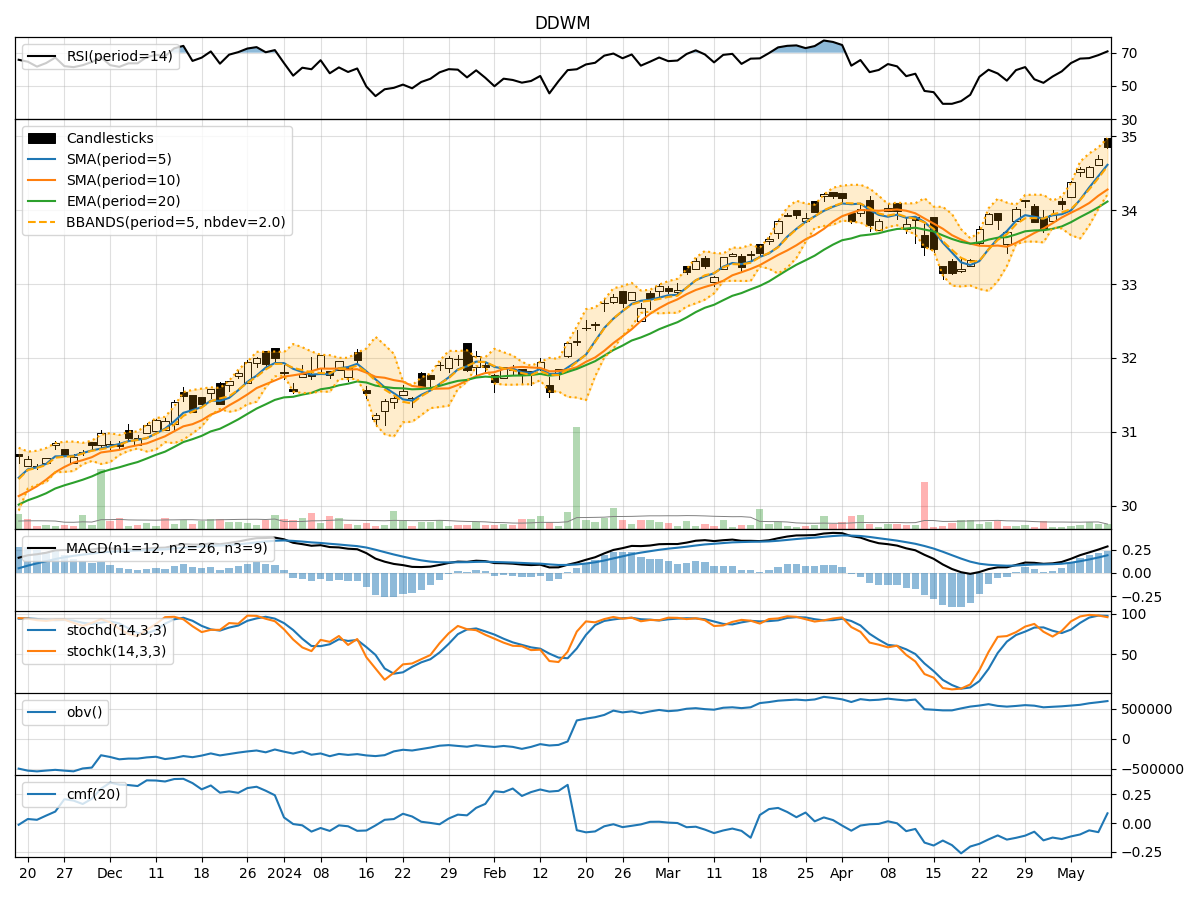
In analyzing the technical indicators for DDWM over the last 5 days, we will delve into the trend, momentum, volatility, and volume indicators to provide a comprehensive outlook on the possible stock price movement in the coming days.
Trend Analysis:
- Moving Averages (MA): The 5-day Moving Average (MA) has been consistently rising, indicating an upward trend in the stock price.
- MACD: The MACD line has been above the signal line for all 5 days, suggesting bullish momentum.
- EMA: The Exponential Moving Average (EMA) has also been trending upwards, supporting the bullish sentiment.
Momentum Analysis:
- RSI: The Relative Strength Index (RSI) has been increasing, showing strengthening momentum.
- Stochastic Oscillator: Both %K and %D have been in overbought territory, indicating a strong bullish momentum.
- Williams %R: The Williams %R is in oversold territory, suggesting a potential reversal in the short term.
Volatility Analysis:
- Bollinger Bands (BB): The stock price has been trading within the upper Bollinger Band, indicating high volatility.
- BB Width: The Bollinger Band width has been narrowing, suggesting a potential decrease in volatility.
- BB %B: The %B indicator is above 0.8, indicating an overbought condition.
Volume Analysis:
- On-Balance Volume (OBV): The OBV has been steadily increasing, reflecting strong buying pressure.
- Chaikin Money Flow (CMF): The CMF has been negative, indicating some distribution in the stock.
Key Observations:
- The trend indicators suggest a strong bullish sentiment with rising moving averages and positive MACD.
- Momentum indicators show overbought conditions, signaling a potential pullback or consolidation.
- Volatility indicators point to high volatility but with signs of a possible decrease in the near term.
- Volume indicators indicate increasing buying pressure but with some distribution as shown by the negative CMF.
Conclusion:
Based on the analysis of the technical indicators, the stock price of DDWM is likely to experience a short-term pullback or consolidation due to the overbought momentum signals and high volatility. However, the overall trend remains bullish supported by the moving averages and MACD. Traders should be cautious of a potential reversal in the short term, but the long-term outlook remains positive.