Technical Analysis of DECT 2024-05-10
Overview:
In analyzing the technical indicators for DECT over the last 5 days, we will delve into the trend, momentum, volatility, and volume indicators to provide a comprehensive outlook on the possible stock price movement in the coming days. By examining these key aspects, we aim to offer valuable insights and predictions to guide your investment decisions.
Trend Indicators:
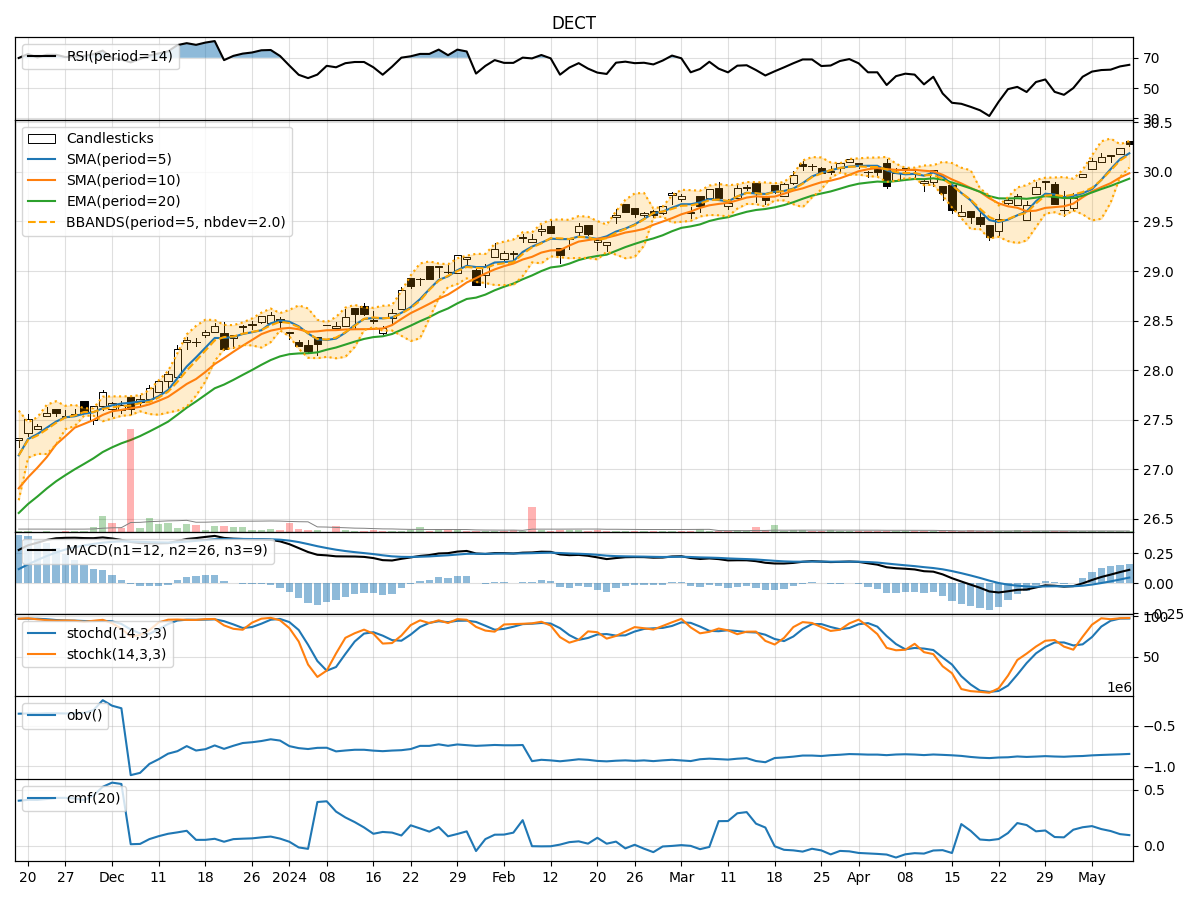
- Moving Averages (MA): The 5-day MA has been consistently above the closing prices, indicating an upward trend.
- MACD: The MACD line has been steadily increasing, with the MACD histogram showing positive values, suggesting bullish momentum.
- EMA: The EMA has been trending upwards, supporting the bullish sentiment.
Momentum Indicators:
- RSI: The RSI has been gradually increasing, indicating strengthening momentum.
- Stochastic Oscillator: Both %K and %D have been in the overbought zone, suggesting a potential reversal or consolidation.
- Williams %R: The indicator has been fluctuating around oversold levels, signaling potential buying opportunities.
Volatility Indicators:
- Bollinger Bands (BB): The bands have been relatively narrow, indicating low volatility.
- BB %B: The %B indicator has been hovering around the middle, suggesting a balanced market sentiment.
Volume Indicators:
- On-Balance Volume (OBV): The OBV has been steadily increasing, reflecting positive buying pressure.
- Chaikin Money Flow (CMF): The CMF has been positive, indicating money flow into the stock.
Key Observations:
- The trend indicators suggest a strong bullish sentiment, supported by the moving averages and MACD.
- Momentum indicators show a mix of overbought and oversold conditions, hinting at a potential reversal or consolidation.
- Volatility remains low, indicating a stable market environment.
- Volume indicators reflect increasing buying pressure and positive money flow into the stock.
Conclusion:
Based on the analysis of the technical indicators, the overall outlook for DECT in the next few days is bullish. The stock is likely to experience further upward movement supported by the strong trend indicators and positive momentum. However, caution is advised as the stochastic oscillator signals potential overbought conditions, which could lead to a short-term pullback or consolidation. Investors should monitor the price action closely and consider taking profits or adjusting their positions accordingly.