Technical Analysis of DECZ 2024-05-10
Overview:
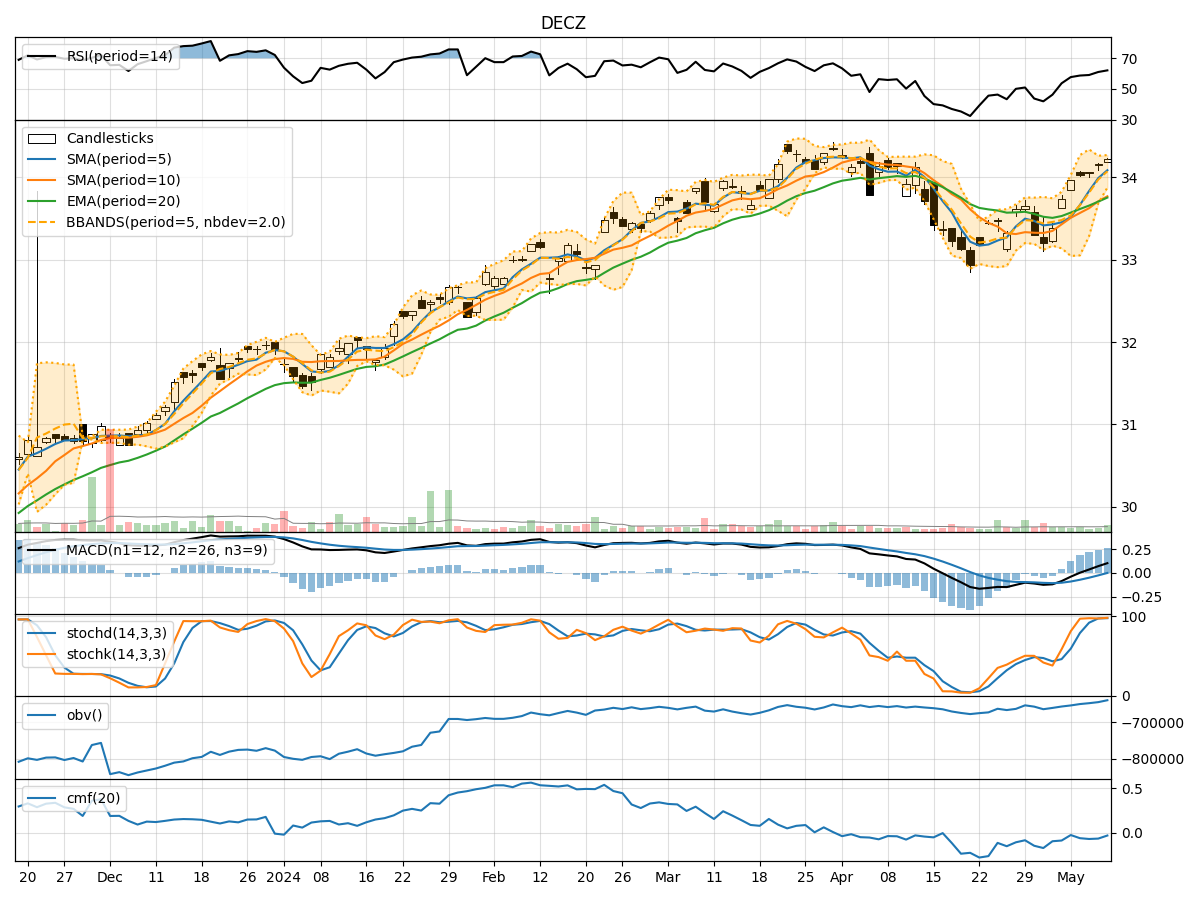
In the last 5 trading days, DECZ stock has shown a consistent uptrend in its price, accompanied by increasing volumes. The moving averages have been trending upwards, indicating a positive momentum. The MACD and RSI have also been on the rise, suggesting bullish sentiment. However, the stock is currently trading near its upper Bollinger Band, indicating potential overbought conditions. Let's delve deeper into each category of technical indicators to provide a comprehensive analysis.
Trend Indicators:
- Moving Averages (MA): The 5-day MA has been consistently above the 10-day SMA, indicating a short-term bullish trend.
- MACD: The MACD line has been above the signal line for the past 5 days, confirming a bullish trend.
- MACD Histogram: The MACD histogram has been increasing, indicating strengthening bullish momentum.
Key Observation: The trend indicators suggest a strong bullish trend in DECZ stock.
Momentum Indicators:
- RSI: The RSI has been increasing and is currently in the overbought territory, suggesting a strong buying momentum.
- Stochastic Oscillator: Both %K and %D lines of the Stochastic Oscillator are in the overbought zone, indicating a potential reversal.
Key Observation: Momentum indicators signal a strong bullish sentiment but also hint at a possible reversal due to overbought conditions.
Volatility Indicators:
- Bollinger Bands (BB): The stock price is currently near the upper Bollinger Band, indicating potential overbought conditions.
- Bollinger %B: The %B is above 0.8, suggesting the stock is trading at the upper end of its recent price range.
Key Observation: Volatility indicators point towards potential overbought conditions and a possible price reversal.
Volume Indicators:
- On-Balance Volume (OBV): The OBV has been steadily increasing, indicating strong buying pressure.
- Chaikin Money Flow (CMF): The CMF has been negative, suggesting some distribution in the stock.
Key Observation: Volume indicators show conflicting signals with OBV indicating buying pressure and CMF suggesting distribution.
Conclusion:
Based on the analysis of technical indicators, DECZ stock is currently in a strong bullish trend with positive momentum. However, the stock is trading near overbought levels, as indicated by the high RSI and Stochastic readings, and the proximity to the upper Bollinger Band. This suggests a potential short-term correction or consolidation in the stock price.
Recommendation: Investors should exercise caution and consider taking profits or implementing risk management strategies as the stock may experience a pullback in the coming days. It is advisable to wait for a clearer signal or confirmation of a new trend direction before making significant trading decisions.
Remember, technical analysis is a valuable tool, but it should be used in conjunction with other forms of analysis for a comprehensive view of the market.