Technical Analysis of DEED 2024-05-10
Overview:
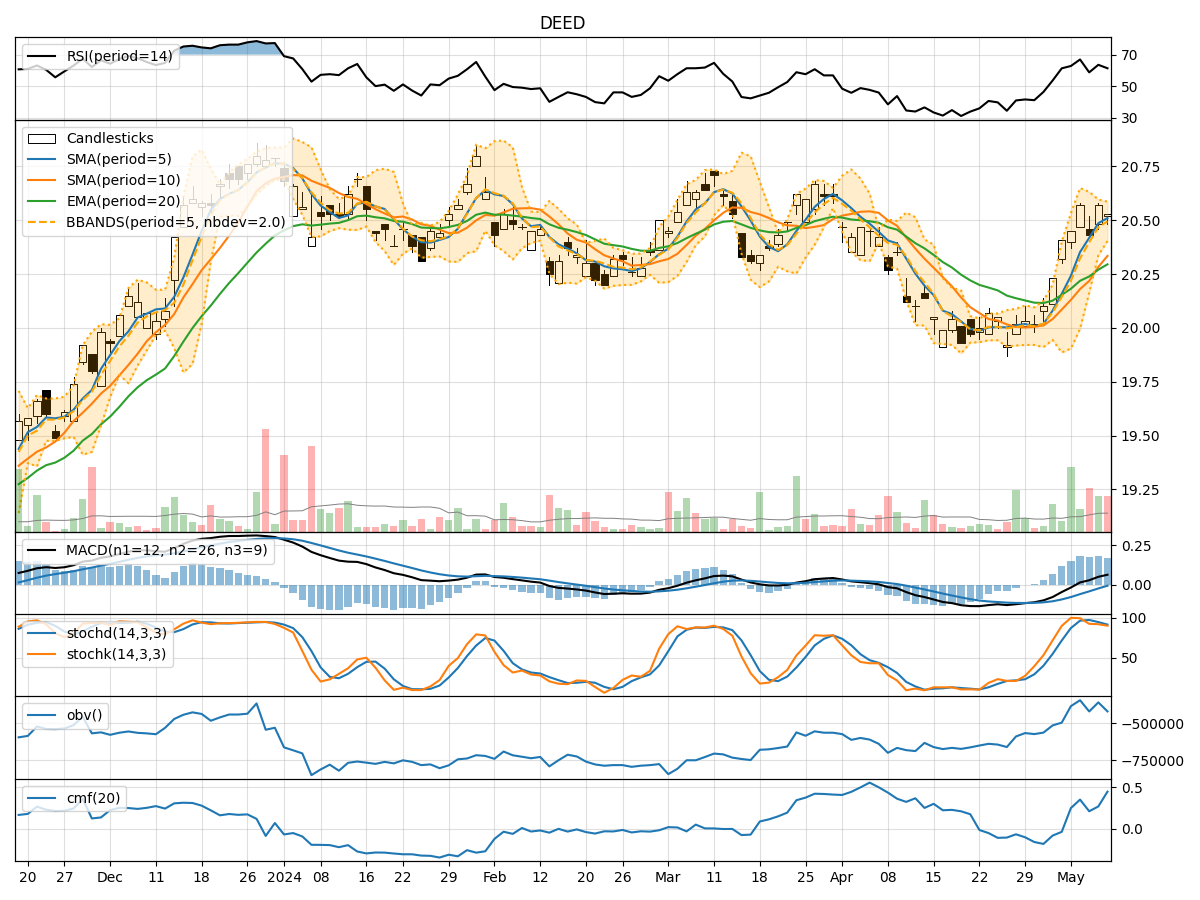
In the last 5 trading days, DEED stock has shown mixed signals across various technical indicators. The trend indicators suggest a slightly bullish sentiment, with the moving averages trending upwards. Momentum indicators show a neutral to slightly bullish stance, while volatility indicators indicate a narrowing of the Bollinger Bands, potentially signaling a decrease in price volatility. Volume indicators show a positive accumulation/distribution trend.
Trend Indicators:
- Moving Averages (MA): The 5-day MA is above both the 10-day SMA and the 20-day EMA, indicating a short-term bullish trend.
- MACD: The MACD line is above the signal line, suggesting bullish momentum.
- MACD Histogram: The histogram is positive, indicating increasing bullish momentum.
Key Observation: The trend indicators point towards a bullish sentiment in the short term.
Momentum Indicators:
- RSI: The RSI is in the neutral zone around 60, indicating neither overbought nor oversold conditions.
- Stochastic Oscillator: Both %K and %D are above 80, suggesting potential overbought conditions.
- Williams %R: The indicator is hovering around -7, indicating a near-overbought condition.
Key Observation: Momentum indicators show a neutral to slightly bullish stance.
Volatility Indicators:
- Bollinger Bands (BB): The bands are narrowing, indicating decreasing price volatility.
- Bollinger %B: The %B is below 1, suggesting the price is closer to the lower band.
Key Observation: Volatility indicators signal a decrease in price volatility.
Volume Indicators:
- On-Balance Volume (OBV): The OBV is showing a positive trend, indicating accumulation.
- Chaikin Money Flow (CMF): The CMF is positive, suggesting buying pressure.
Key Observation: Volume indicators indicate positive accumulation.
Conclusion:
Based on the analysis of the technical indicators, the next few days for DEED stock are likely to see a continuation of the bullish trend in the short term. The moving averages, MACD, and positive volume accumulation support this view. However, caution is advised as the momentum indicators suggest potential overbought conditions, and the narrowing Bollinger Bands could lead to a period of consolidation or a minor pullback before any further upward movement.
Overall Assessment: The stock is likely to experience upward movement in the next few days, but traders should monitor for signs of potential reversal or consolidation given the mixed signals from momentum indicators.