Technical Analysis of DEEF 2024-05-10
Overview:
In analyzing the technical indicators for DEEF over the last 5 days, we will delve into the trend, momentum, volatility, and volume indicators to provide a comprehensive outlook on the possible stock price movement. By examining these key aspects, we aim to offer valuable insights and predictions for the upcoming days.
Trend Indicators:
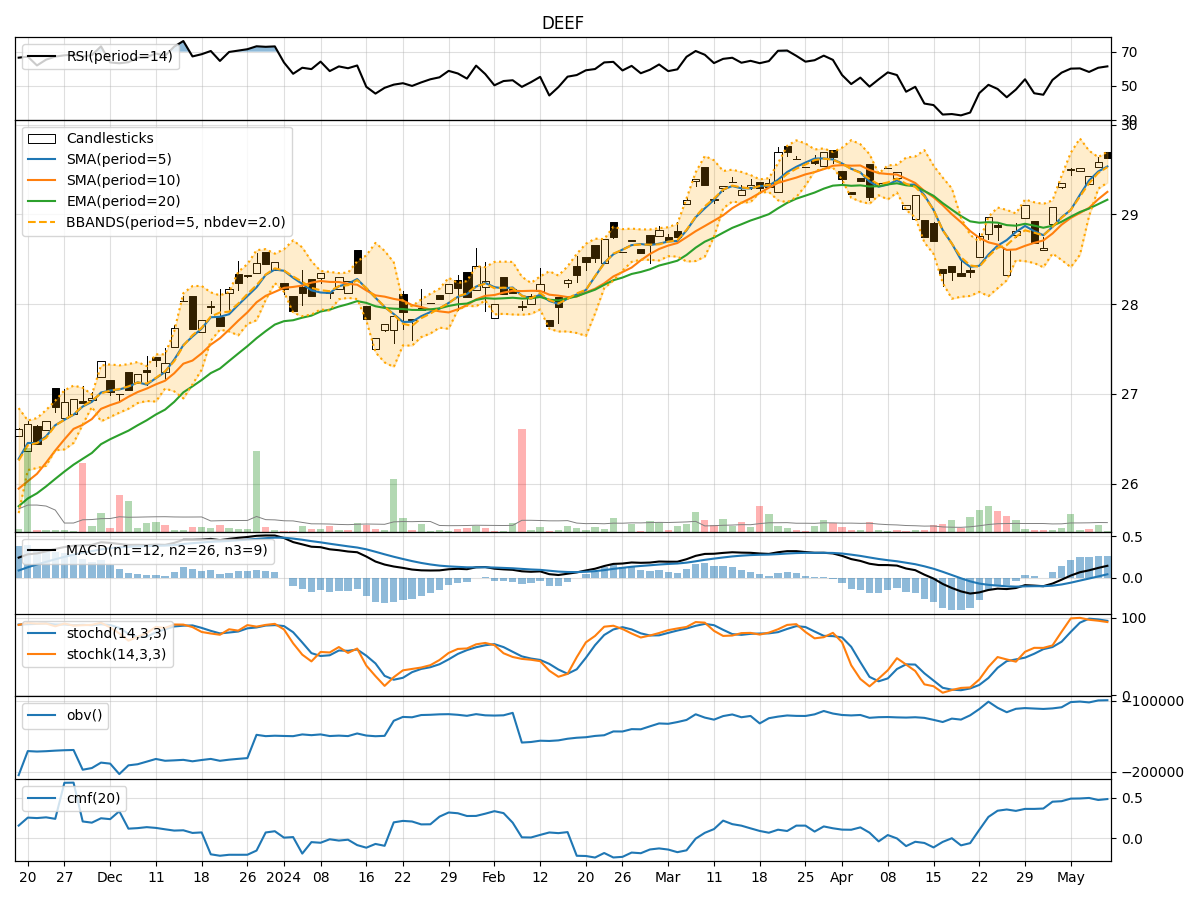
- Moving Averages (MA): The 5-day Moving Average has been consistently above the Simple Moving Average (SMA) and Exponential Moving Average (EMA), indicating a bullish trend.
- MACD: The MACD line has been consistently above the signal line, with positive values, suggesting a bullish momentum.
Momentum Indicators:
- RSI: The Relative Strength Index (RSI) has been hovering around 60, indicating a neutral stance.
- Stochastic Oscillator: Both %K and %D have been gradually decreasing but still in the overbought territory, signaling a potential reversal.
Volatility Indicators:
- Bollinger Bands (BB): The stock price has been trading within the bands, with the upper band acting as resistance and the lower band as support.
Volume Indicators:
- On-Balance Volume (OBV): The OBV has shown a slight increase, indicating accumulation.
- Chaikin Money Flow (CMF): The CMF has been positive, suggesting buying pressure.
Key Observations:
- The trend indicators point towards a bullish sentiment, supported by the MACD and moving averages.
- Momentum indicators show a potential reversal in the overbought territory, indicating a possible correction.
- Volatility remains relatively stable within the Bollinger Bands, with no significant breakout signals.
- Volume indicators suggest a slight increase in buying pressure, as seen in OBV and CMF.
Conclusion:
Based on the analysis of the technical indicators, the next few days for DEEF could see a consolidation phase with a potential correction in the stock price. The bullish trend may pause temporarily as momentum indicators signal a reversal from the overbought levels. Traders should watch for key support and resistance levels within the Bollinger Bands to gauge potential price movements. Overall, a cautious approach is recommended, considering the mixed signals from the indicators.