Technical Analysis of DEEP 2024-05-10
Overview:
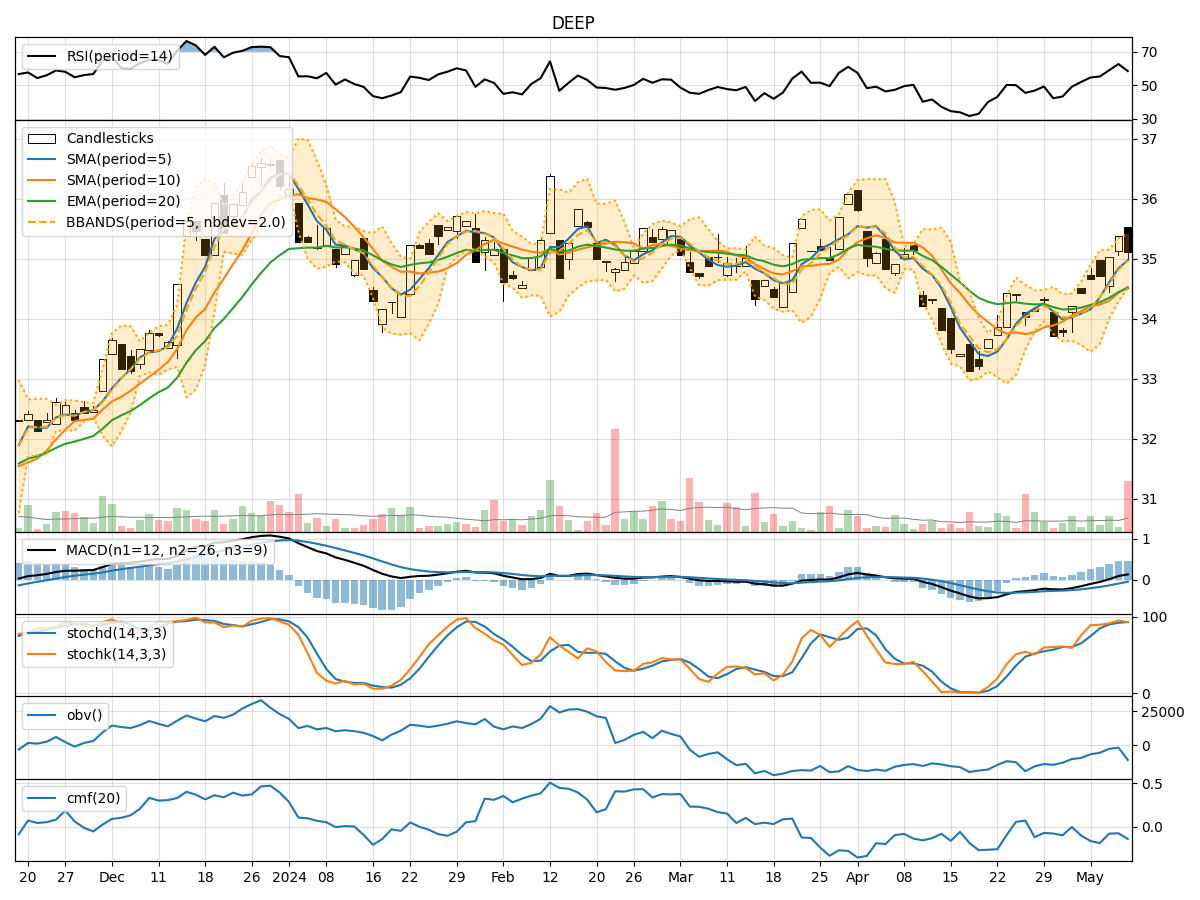
In the last 5 trading days, the stock price of DEEP has shown a gradual increase, with some fluctuations in between. Various technical indicators have been analyzed to provide insights into the possible future stock price movement. The trend indicators suggest a positive momentum, while momentum indicators show a strengthening bullish sentiment. Volatility indicators indicate a narrowing of the price range, and volume indicators reflect mixed signals.
Trend Indicators Analysis:
- Moving averages (MA) show an upward trend, with the 5-day MA consistently above the longer-term SMAs and EMAs.
- MACD is positive, indicating a bullish trend, and the MACD histogram is also showing an increasing positive momentum.
Momentum Indicators Analysis:
- RSI is in the neutral zone, indicating potential room for further price movement in either direction.
- Stochastic oscillators are in the overbought region, suggesting a potential reversal or consolidation.
- Williams %R is in the oversold region, indicating a possible buying opportunity.
Volatility Indicators Analysis:
- Bollinger Bands are narrowing, indicating reduced volatility and a potential breakout or breakdown.
- The Bollinger Band %B is below 1, suggesting a possible consolidation phase.
Volume Indicators Analysis:
- On-Balance Volume (OBV) is negative, indicating selling pressure in the stock.
- Chaikin Money Flow (CMF) is negative, suggesting outflow of money from the stock.
Key Observations and Opinions:
- Trend: The stock is in an upward trend, supported by moving averages and MACD. Bullish
- Momentum: Mixed signals from RSI and stochastic oscillators. Neutral
- Volatility: Bollinger Bands narrowing, indicating a potential breakout. Consolidation
- Volume: Negative OBV and CMF suggest selling pressure. Bearish
Conclusion:
Based on the analysis of technical indicators, the next few days' possible stock price movement for DEEP is likely to be sideways with a bearish bias. Traders should watch for a potential breakout from the narrowing Bollinger Bands for a clearer direction. It is advisable to exercise caution and wait for confirmation from multiple indicators before making any significant trading decisions.