Technical Analysis of DEM 2024-05-10
Overview:
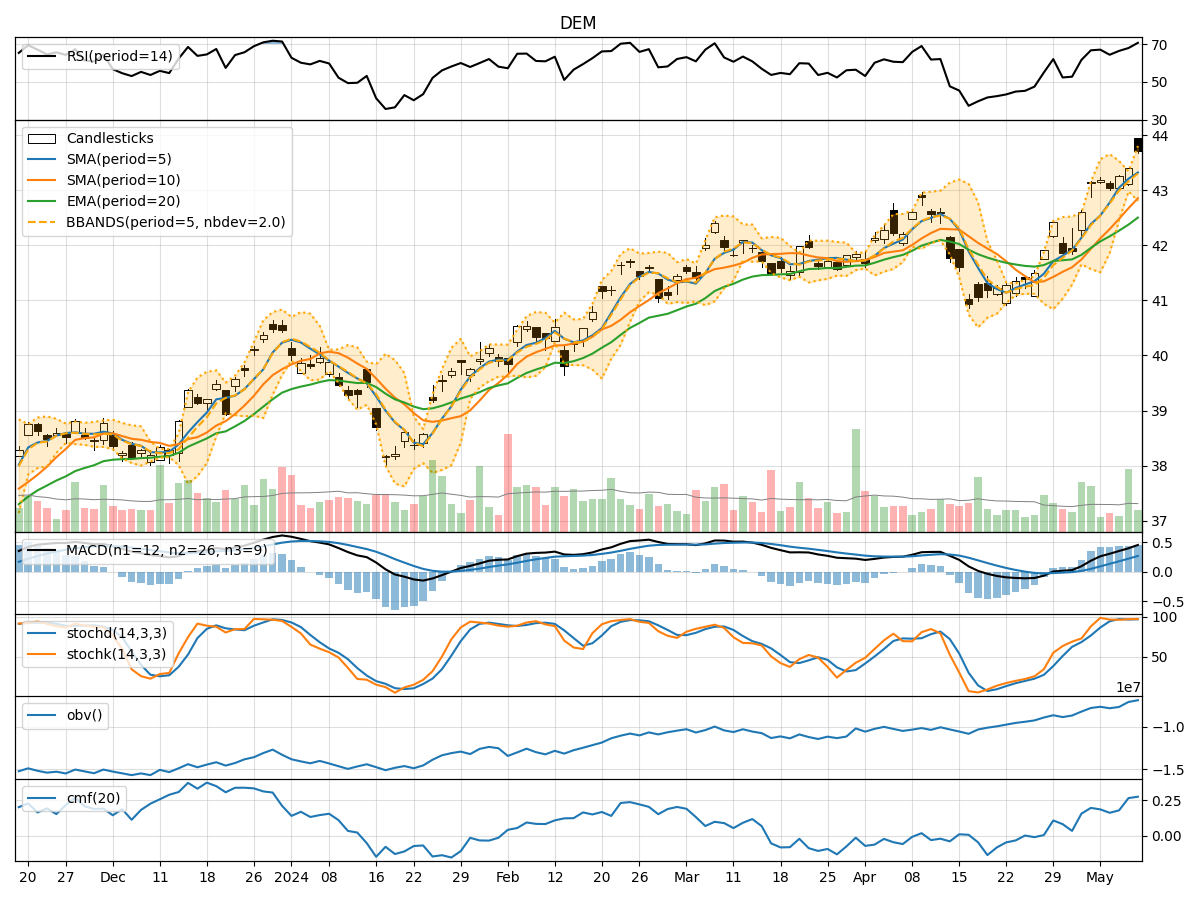
In the last 5 trading days, DEM stock has shown a consistent uptrend in its price, supported by increasing volume and positive momentum indicators. The stock has been trading above its moving averages and the Bollinger Bands, indicating strength in the trend. However, the stock is currently in overbought territory based on the RSI and stochastic indicators. Let's delve deeper into each category of technical indicators to provide a comprehensive analysis and make a prediction for the next few days.
Trend Indicators:
- Moving Averages (MA): The stock's closing price has been consistently above the 5-day moving average, indicating a short-term uptrend. The SMA(10) and EMA(20) also show an increasing trend, supporting the bullish momentum.
- MACD: The MACD line has been above the signal line for the past 5 days, indicating a bullish signal. The MACD histogram has been increasing, showing strengthening bullish momentum.
Momentum Indicators:
- RSI: The RSI has been trending upwards and is currently in the overbought zone above 70, suggesting that the stock may be overvalued in the short term.
- Stochastic Oscillator: Both %K and %D lines are in the overbought zone, indicating a potential reversal or consolidation in the near future.
- Williams %R: The Williams %R is also in the overbought territory, signaling a possible pullback or correction.
Volatility Indicators:
- Bollinger Bands: The stock price has been trading near the upper Bollinger Band, indicating that the stock is overextended in the short term. A potential reversion to the mean or a pullback can be expected.
- Bollinger %B: The %B indicator is above 0.8, suggesting that the stock is trading at the upper end of its recent price range.
Volume Indicators:
- On-Balance Volume (OBV): The OBV has been steadily increasing over the past 5 days, indicating strong buying pressure and accumulation of the stock.
- Chaikin Money Flow (CMF): The CMF is positive and has been trending upwards, reflecting buying interest in the stock.
Conclusion:
Based on the technical indicators and analysis: - Trend: The stock is in a strong uptrend, supported by moving averages and MACD. - Momentum: The stock is currently overbought based on RSI, Stochastic, and Williams %R, suggesting a potential reversal or consolidation. - Volatility: The stock is trading near the upper Bollinger Band, indicating overextension and a possible pullback. - Volume: Strong buying pressure is evident from increasing OBV and positive CMF.
Prediction:
Given the overbought conditions and the stock's proximity to the upper Bollinger Band, a short-term correction or consolidation is likely in the next few days. Traders should exercise caution and consider taking profits or implementing risk management strategies.