Technical Analysis of DES 2024-05-10
Overview:
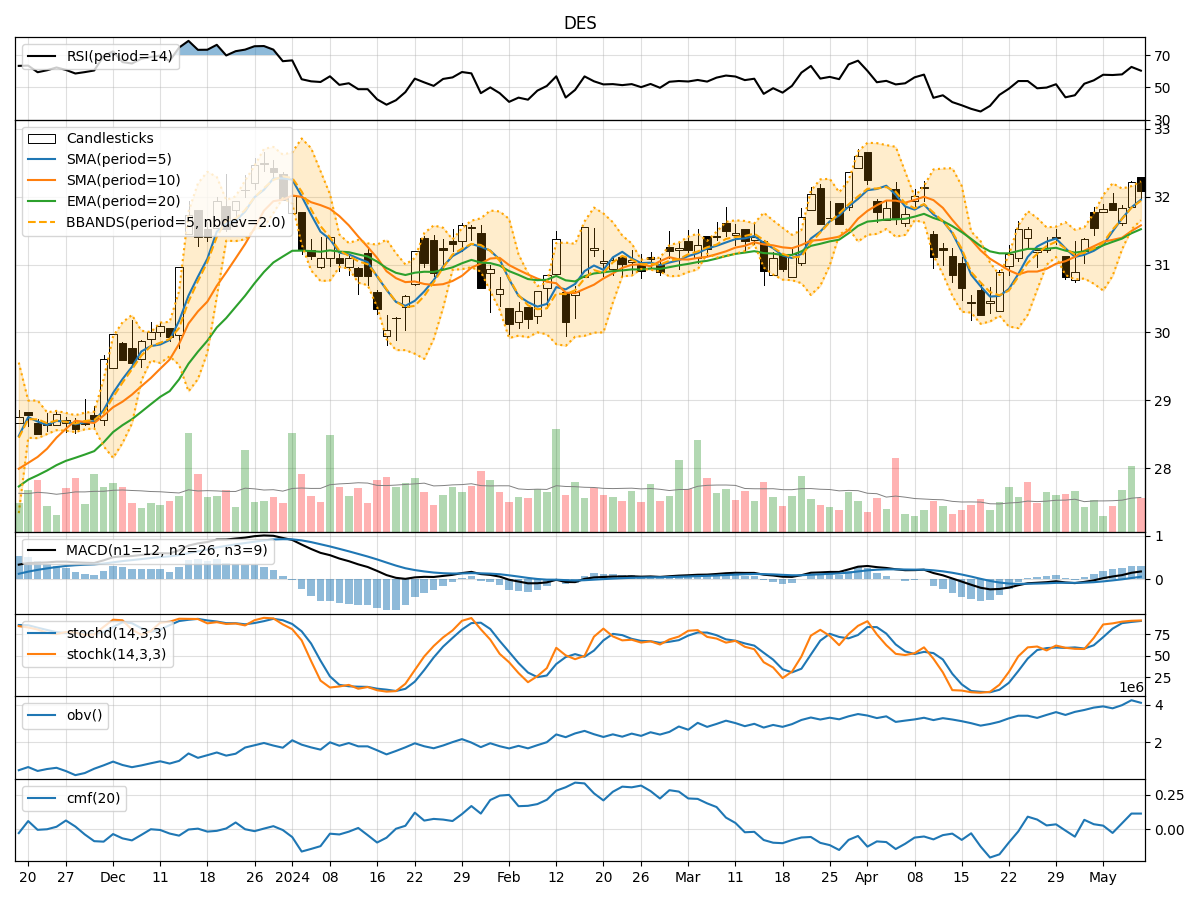
In analyzing the technical indicators for DES stock over the last 5 days, we will delve into the trend, momentum, volatility, and volume indicators to provide a comprehensive outlook on the possible stock price movement in the coming days.
Trend Analysis:
- Moving Averages (MA): The 5-day Moving Average (MA) has been trending upwards, indicating a positive momentum in the stock price.
- MACD: The MACD line has been consistently above the signal line, suggesting a bullish trend.
- EMA: The Exponential Moving Average (EMA) has been steadily increasing, supporting the bullish sentiment in the stock.
Momentum Analysis:
- RSI: The Relative Strength Index (RSI) has been fluctuating around the overbought territory, indicating strong buying momentum.
- Stochastic Oscillator: Both %K and %D lines of the Stochastic Oscillator have been in the overbought zone, signaling a potential reversal.
- Williams %R: The Williams %R is in the oversold region, suggesting a possible buying opportunity.
Volatility Analysis:
- Bollinger Bands: The Bollinger Bands have been narrowing, indicating decreasing volatility in the stock price.
- Bollinger %B: The %B indicator is hovering around 0.7, suggesting the stock is trading closer to the upper band.
Volume Analysis:
- On-Balance Volume (OBV): The OBV has been increasing, reflecting higher buying volume in the stock.
- Chaikin Money Flow (CMF): The CMF has been positive, indicating strong buying pressure in the stock.
Key Observations:
- The trend indicators suggest a bullish sentiment with moving averages and MACD supporting an upward trajectory.
- Momentum indicators show mixed signals with RSI in the overbought zone and Stochastic Oscillator hinting at a potential reversal.
- Volatility has been decreasing, indicating a possible period of consolidation.
- Volume indicators reflect increasing buying volume and positive money flow into the stock.
Conclusion:
Based on the analysis of technical indicators, the stock is likely to experience a continuation of the bullish trend in the short term. However, caution is advised as momentum indicators show signs of potential reversal, and the stock may enter a consolidation phase. Traders should closely monitor the Stochastic Oscillator for a possible shift in momentum. Overall, the outlook remains bullish with a possibility of short-term consolidation.