Technical Analysis of DEUS 2024-05-10
Overview:
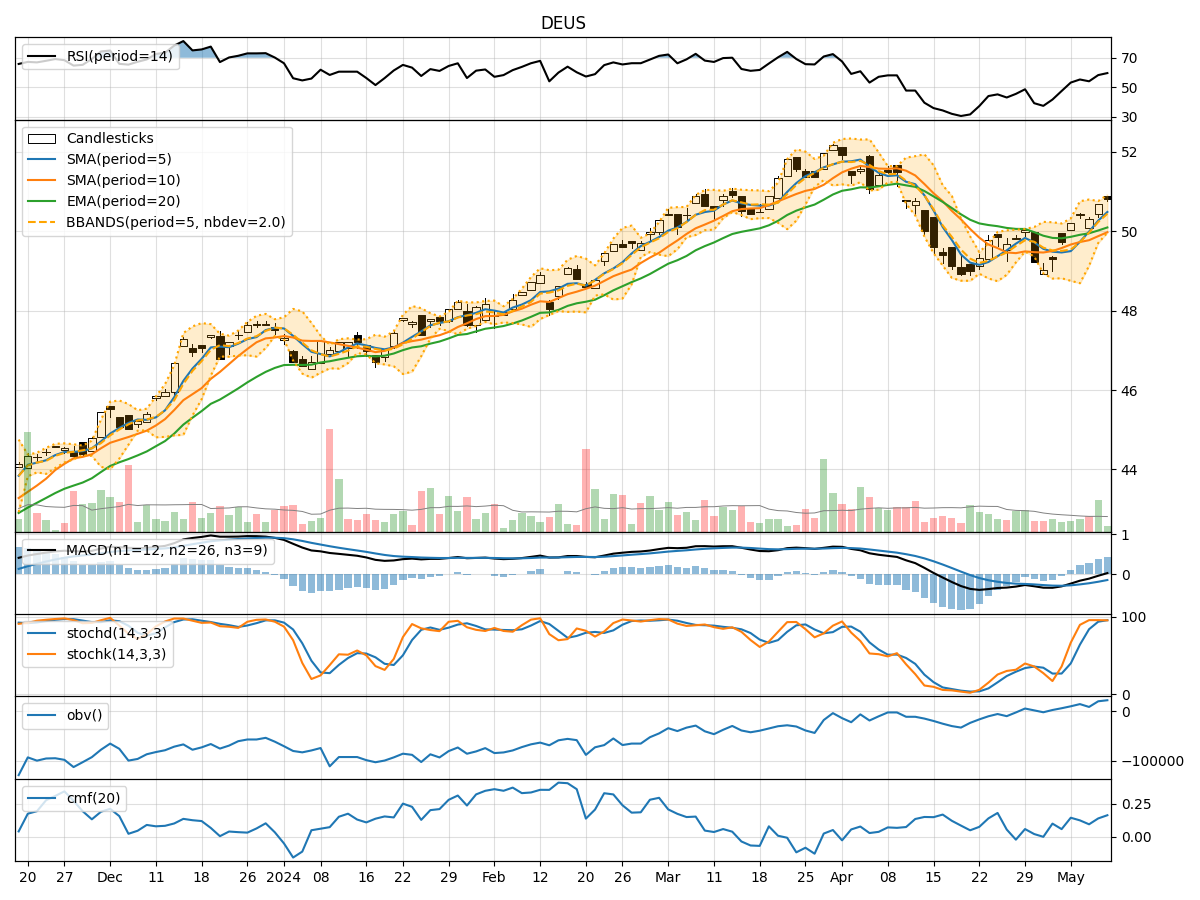
In the last 5 trading days, DEUS stock has shown a consistent uptrend in its price, accompanied by increasing trading volumes. The moving averages have been trending upwards, indicating a positive momentum in the stock. The MACD and RSI indicators also suggest bullish sentiment. However, the stock is currently trading near its upper Bollinger Band, indicating a potential overbought situation. Let's delve deeper into each category of technical indicators to provide a comprehensive analysis and make a prediction for the next few days.
Trend Indicators:
- Moving Averages (MA): The 5-day MA has been consistently above the 10-day SMA, indicating a short-term bullish trend. The EMA(20) is also trending upwards, supporting the bullish momentum.
- MACD: The MACD line has been above the signal line for the past few days, indicating a bullish trend. The MACD histogram is also in positive territory, suggesting upward momentum.
Momentum Indicators:
- RSI: The RSI has been in the overbought territory, indicating a strong bullish momentum. However, it's essential to note that sustained overbought conditions may lead to a potential reversal.
- Stochastic Oscillator: Both %K and %D lines are in the overbought zone, suggesting a strong bullish momentum. However, caution is advised as the stock may be due for a pullback.
Volatility Indicators:
- Bollinger Bands: The stock is currently trading near the upper Bollinger Band, indicating that it may be overextended in the short term. A potential pullback or consolidation could be on the horizon.
Volume Indicators:
- On-Balance Volume (OBV): The OBV has been steadily increasing over the past few days, indicating strong buying pressure. This aligns with the price appreciation and suggests a bullish sentiment.
- Chaikin Money Flow (CMF): The CMF(20) is positive, indicating that money is flowing into the stock. This supports the bullish outlook.
Key Observations:
- The stock is exhibiting strong bullish momentum across various indicators, supported by increasing volumes and positive trend signals.
- However, the stock is currently in the overbought territory based on RSI and Stochastic indicators, suggesting a potential reversal or pullback in the short term.
- The proximity to the upper Bollinger Band indicates a possible overextension, which could lead to a period of consolidation or a minor correction.
Conclusion:
Based on the analysis of technical indicators, the stock is likely to experience a short-term pullback or consolidation in the coming days. While the overall trend remains bullish, the overbought conditions and proximity to the upper Bollinger Band suggest a temporary pause or correction in price. Traders should exercise caution and consider taking profits or implementing risk management strategies in anticipation of a potential retracement.