Technical Analysis of DFAC 2024-05-10
Overview:
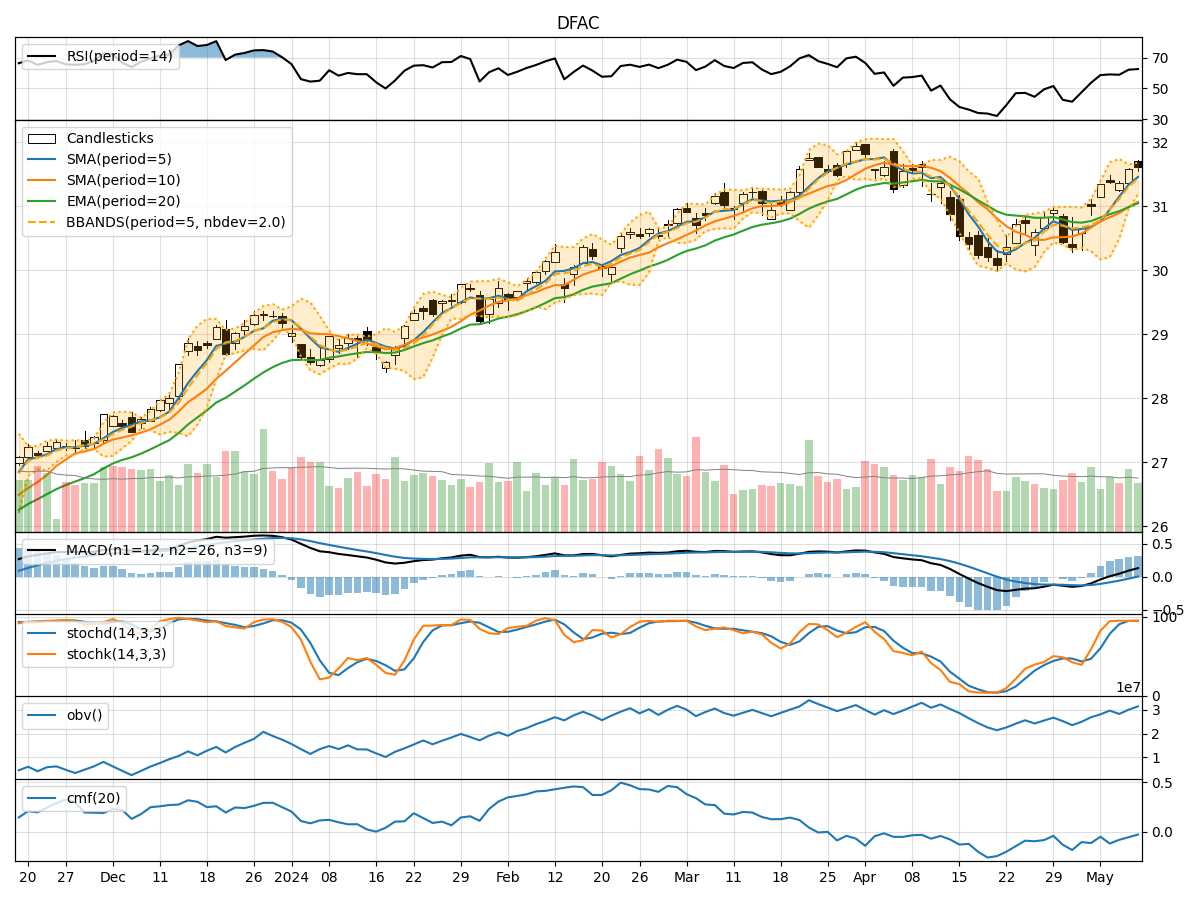
In the last 5 trading days, DFAC stock has shown a consistent uptrend in both price and volume. The moving averages have been trending upwards, indicating a bullish sentiment. Momentum indicators like RSI and Stochastic oscillators suggest the stock is in overbought territory but still showing strength. Volatility indicators show a narrowing of Bollinger Bands, indicating potential consolidation. Volume indicators have been positive, showing accumulation.
Trend Analysis:
- Moving Averages (MA): The 5-day MA has been consistently above the 10-day SMA, indicating a short-term bullish trend. The EMA(20) has been trending upwards, supporting the bullish sentiment.
- MACD: The MACD line has been above the signal line for the past few days, indicating bullish momentum. The MACD histogram has been increasing, showing strengthening bullish momentum.
Momentum Analysis:
- RSI: The RSI has been in the overbought territory, suggesting a potential pullback. However, it's important to note that overbought conditions can persist in strong uptrends.
- Stochastic Oscillators: Both %K and %D have been in the overbought zone, indicating a strong upward momentum. The Williams %R is also in the oversold region, suggesting potential profit-taking.
Volatility Analysis:
- Bollinger Bands: The narrowing of the Bollinger Bands indicates decreasing volatility and a potential period of consolidation. This could be a precursor to a breakout in either direction.
Volume Analysis:
- On-Balance Volume (OBV): The OBV has been steadily increasing over the past 5 days, indicating strong buying pressure and accumulation by investors.
- Chaikin Money Flow (CMF): The CMF has been negative but improving, suggesting that despite some distribution, there is an overall positive flow of money into the stock.
Conclusion:
Based on the technical indicators and analysis: - Trend: The stock is in a strong upward trend. - Momentum: While overbought, momentum indicators suggest continued strength. - Volatility: The narrowing Bollinger Bands indicate a potential period of consolidation. - Volume: Accumulation is strong, indicating investor interest.
Forecast:
Given the current technical setup, the next few days could see the stock price consolidating within a narrow range before a potential breakout. The overall outlook remains bullish, but a short-term pullback or consolidation phase would not be surprising given the overbought conditions. Traders should watch for a breakout above the upper Bollinger Band or a pullback to key support levels for potential entry points.