Technical Analysis of DFAE 2024-05-10
Overview:
In analyzing the technical indicators for DFAE stock over the last 5 days, we will delve into the trend, momentum, volatility, and volume indicators to provide a comprehensive outlook on the possible stock price movement in the coming days. By examining these key indicators, we aim to offer valuable insights and predictions for potential investors.
Trend Indicators:
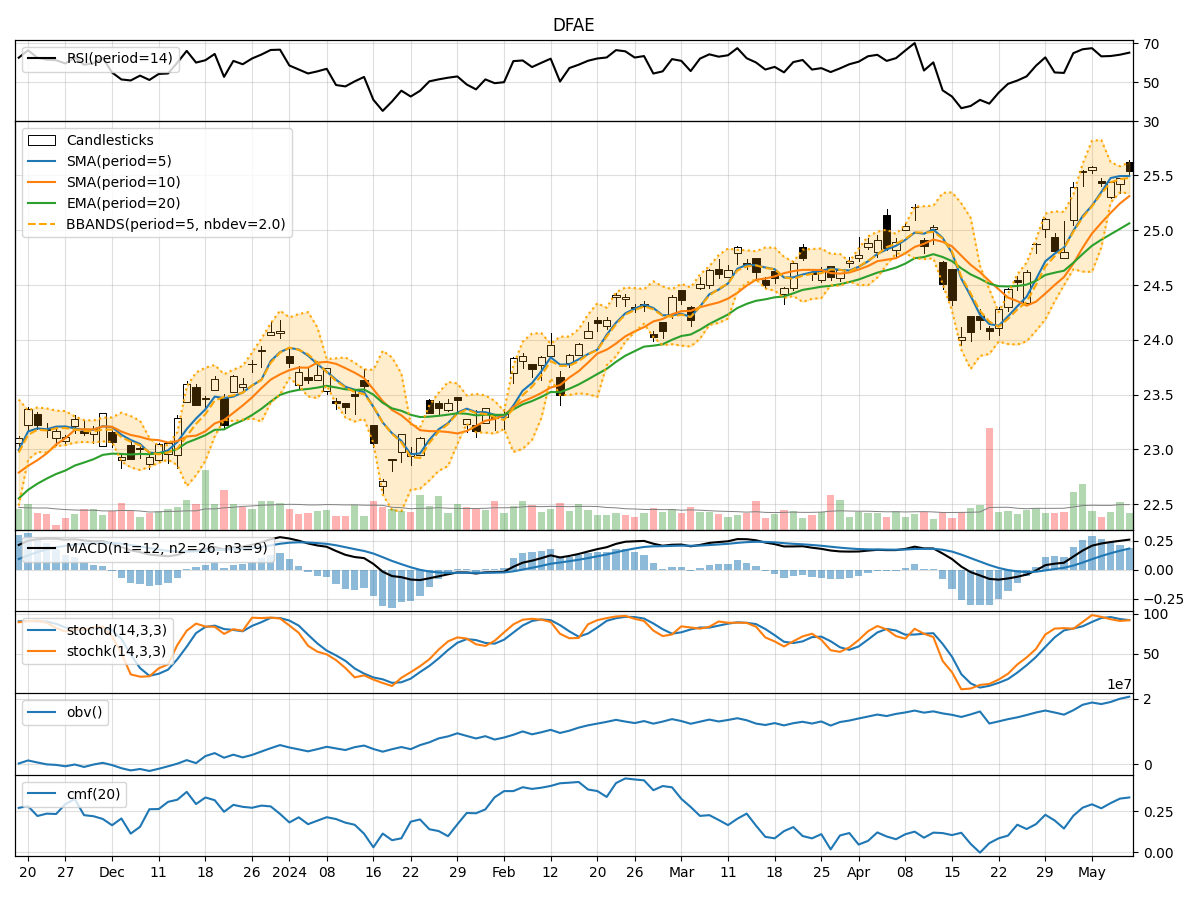
- Moving Averages (MA): The 5-day Moving Average (MA) has been consistently above the Simple Moving Average (SMA) and Exponential Moving Average (EMA), indicating a bullish trend.
- MACD: The MACD line has been consistently above the signal line, with both lines showing an upward trend, suggesting bullish momentum.
- MACD Histogram: The MACD Histogram has been increasing over the past 5 days, indicating strengthening bullish momentum.
Momentum Indicators:
- RSI: The Relative Strength Index (RSI) has been in the overbought territory but has shown a slight decrease, indicating a potential cooling off of the stock's momentum.
- Stochastic Oscillator: Both %K and %D lines of the Stochastic Oscillator have been fluctuating in the overbought zone, suggesting a possible reversal or consolidation.
- Williams %R: The Williams %R has been hovering in the oversold region, indicating a potential reversal in the stock's price movement.
Volatility Indicators:
- Bollinger Bands: The Bollinger Bands have shown a narrowing of the bands, indicating decreasing volatility and a potential period of consolidation.
- Bollinger %B: The %B indicator has been fluctuating within a narrow range, suggesting a lack of strong directional movement.
- Average True Range (ATR): The ATR has shown a decrease in volatility over the past 5 days, indicating a potential stabilization in price movements.
Volume Indicators:
- On-Balance Volume (OBV): The OBV has shown a consistent increase over the last 5 days, indicating strong buying pressure and accumulation of the stock.
- Chaikin Money Flow (CMF): The CMF has been positive and increasing, indicating a bullish money flow into the stock.
Conclusion:
Based on the analysis of the technical indicators, the stock of DFAE is currently exhibiting bullish tendencies in terms of trend and momentum. However, there are signs of overbought conditions in the momentum indicators, suggesting a potential reversal or consolidation in the near future. The volatility indicators point towards a decreasing volatility and a possible period of consolidation. The volume indicators indicate strong buying pressure and accumulation of the stock.
Therefore, the next few days for DFAE stock are likely to see a consolidation phase with a potential for a short-term pullback or sideways movement as the stock digests its recent gains. Investors should closely monitor the momentum indicators for any signs of a reversal and adjust their trading strategies accordingly.