Technical Analysis of DFAS 2024-05-10
Overview:
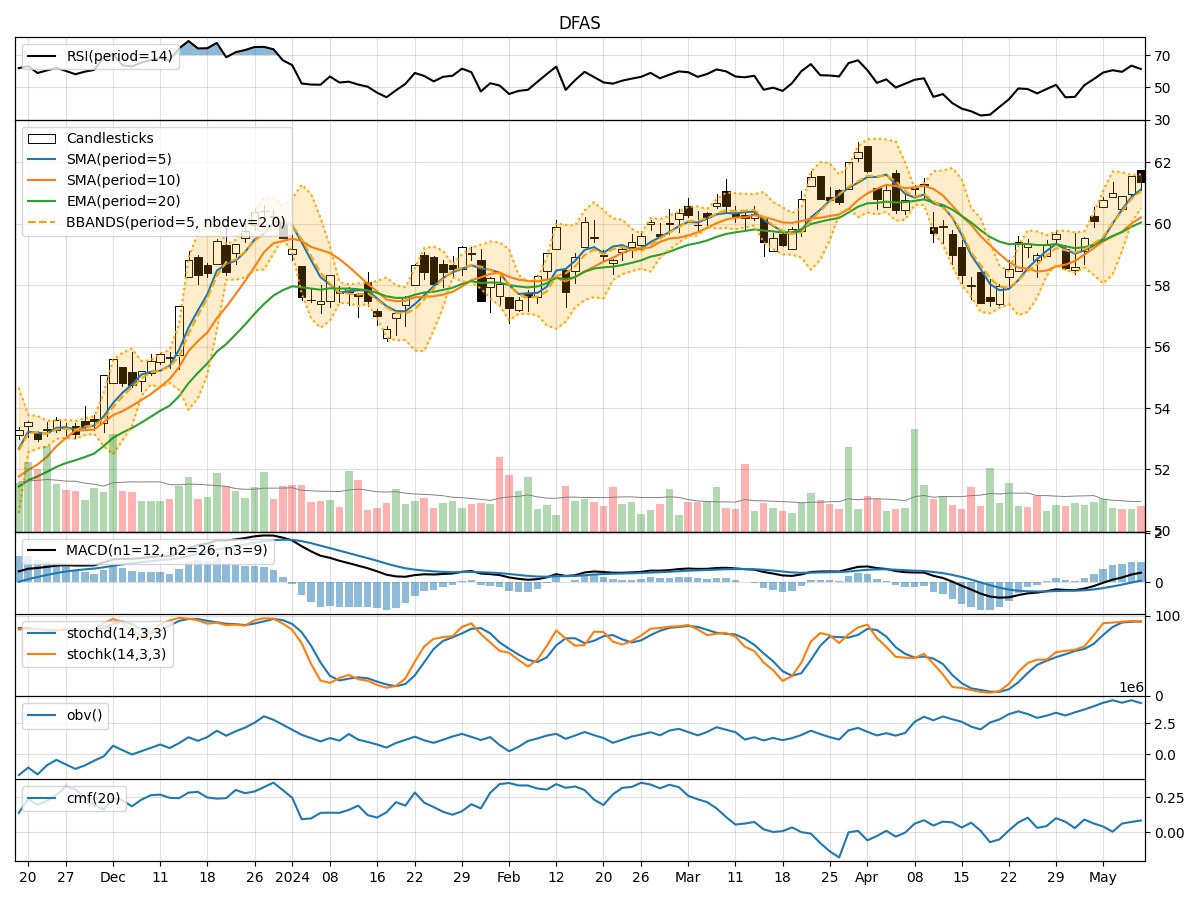
In the last 5 trading days, DFAS stock has shown a consistent uptrend in its price movement. The moving averages have been trending upwards, with the MACD indicating a strengthening bullish momentum. The RSI and Stochastic indicators are in overbought territory, suggesting a potential pullback. Volatility has been relatively stable, and volume has been increasing, indicating growing interest in the stock.
Trend Indicators Analysis:
- Moving Averages (MA): The 5-day MA has been consistently above the longer-term SMAs, indicating a short-term bullish trend.
- MACD: The MACD line has been above the signal line, with both lines trending upwards, indicating a strengthening bullish momentum.
Key Observation: The trend indicators suggest a strong bullish sentiment in the stock.
Momentum Indicators Analysis:
- RSI: The RSI has been in overbought territory, indicating a potential reversal or pullback in the stock price.
- Stochastic Oscillator: Both %K and %D lines are in overbought territory, suggesting a possible upcoming correction.
Key Observation: Momentum indicators signal a potential short-term reversal or consolidation.
Volatility Indicators Analysis:
- Bollinger Bands (BB): The stock price has been trading within the bands, indicating stable volatility.
Key Observation: Volatility has been relatively stable, with no significant spikes or drops.
Volume Indicators Analysis:
- On-Balance Volume (OBV): The OBV has been increasing, indicating accumulation of the stock.
- Chaikin Money Flow (CMF): The CMF has been positive, suggesting buying pressure in the stock.
Key Observation: Volume indicators show growing interest and accumulation in the stock.
Conclusion:
Based on the technical indicators analysis: - Trend: The stock is in a strong bullish trend. - Momentum: There is a possibility of a short-term pullback or consolidation due to overbought conditions. - Volatility: Volatility is stable, indicating a controlled price movement. - Volume: Accumulation and positive CMF suggest buying pressure in the stock.
Forecast:
Considering the overall bullish trend and positive volume indicators, the stock is likely to continue its upward movement in the next few days. However, the overbought conditions in momentum indicators suggest a potential short-term pullback or consolidation before resuming the uptrend. Traders should watch for signs of reversal or consolidation in the coming days but maintain a bullish bias for the stock in the medium to long term.