Technical Analysis of DFAT 2024-05-10
Overview:
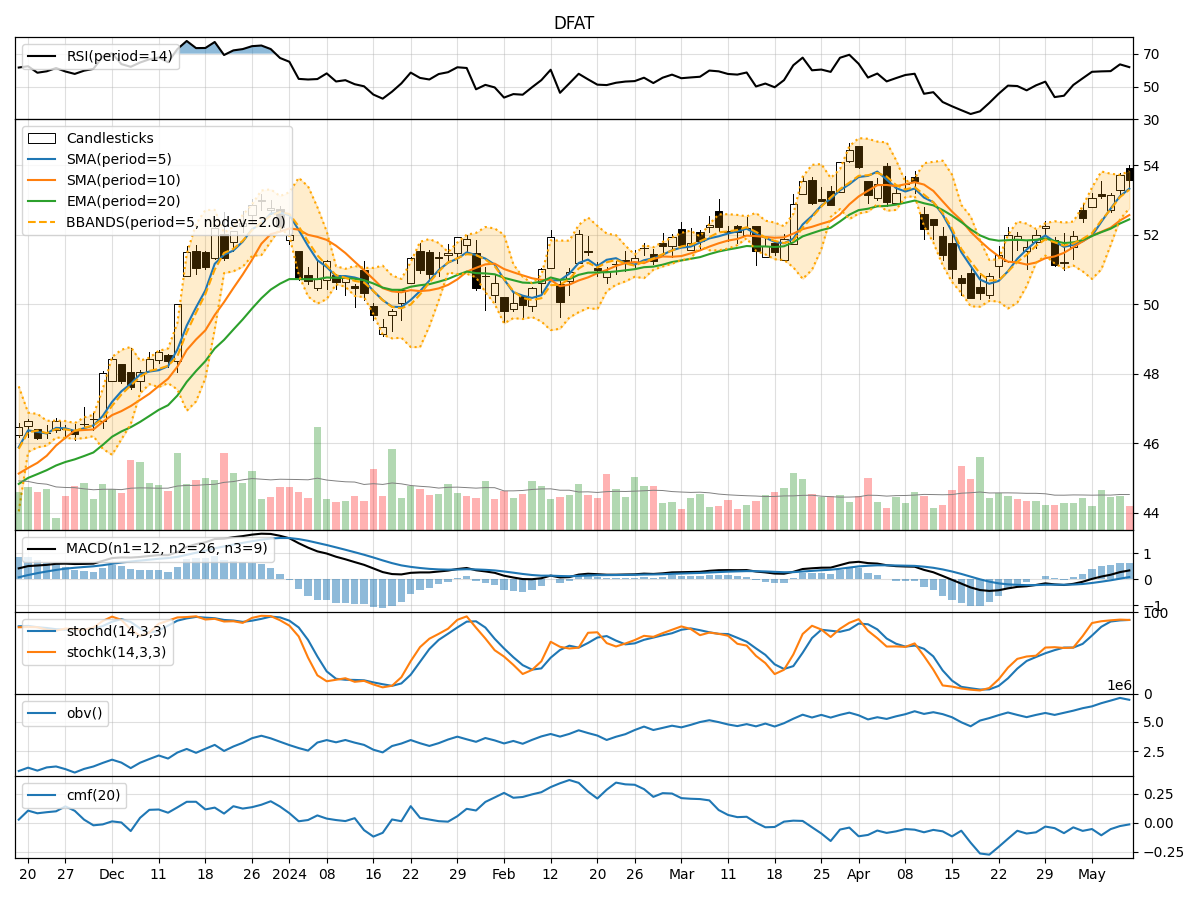
In analyzing the technical indicators for DFAT over the last 5 days, we will delve into the trend, momentum, volatility, and volume indicators to provide a comprehensive outlook on the possible stock price movement. By examining these key aspects, we aim to offer valuable insights and predictions for the upcoming days.
Trend Analysis:
- Moving Averages (MA): The 5-day Moving Average (MA) has been consistently rising, indicating a bullish trend in the short term.
- MACD: The Moving Average Convergence Divergence (MACD) has shown positive values, suggesting upward momentum in the stock price.
- EMA: The Exponential Moving Average (EMA) has been trending upwards, supporting the bullish sentiment in the market.
Momentum Analysis:
- RSI: The Relative Strength Index (RSI) has been in the overbought territory, indicating a strong bullish momentum.
- Stochastic Oscillator: Both %K and %D values have been high, signaling a strong buying pressure in the market.
- Williams %R: The Williams %R is in the oversold region, suggesting a potential reversal in the short term.
Volatility Analysis:
- Bollinger Bands: The Bollinger Bands have been narrowing, indicating decreasing volatility in the stock price.
- Bollinger %B: The %B value has been fluctuating around the midline, suggesting a period of consolidation.
- Average True Range (ATR): The ATR has been relatively stable, indicating consistent price movements.
Volume Analysis:
- On-Balance Volume (OBV): The OBV has shown a slight decrease, indicating some distribution in the stock.
- Chaikin Money Flow (CMF): The CMF has been negative, suggesting outflows from the stock.
Key Observations:
- The trend indicators point towards a bullish sentiment in the market, supported by the positive MACD and rising moving averages.
- Momentum indicators reflect a strong buying pressure, as indicated by the overbought RSI and high stochastic values.
- Volatility has been decreasing, suggesting a period of consolidation and potential price stability.
- Volume indicators show some distribution in the stock, as seen in the negative OBV and CMF values.
Conclusion:
Based on the analysis of the technical indicators, the next few days' possible stock price movement for DFAT is likely to continue in an upward direction. The bullish trend, strong momentum, decreasing volatility, and stable volume support a positive outlook for the stock. Traders and investors may consider buying opportunities in anticipation of further price appreciation.