Technical Analysis of DFAU 2024-05-10
Overview:
In analyzing the technical indicators for DFAU over the last 5 days, we will delve into the trend, momentum, volatility, and volume indicators to provide a comprehensive assessment of the stock's potential price movement. By examining these key factors, we aim to offer valuable insights and predictions for the next few days.
Trend Analysis:
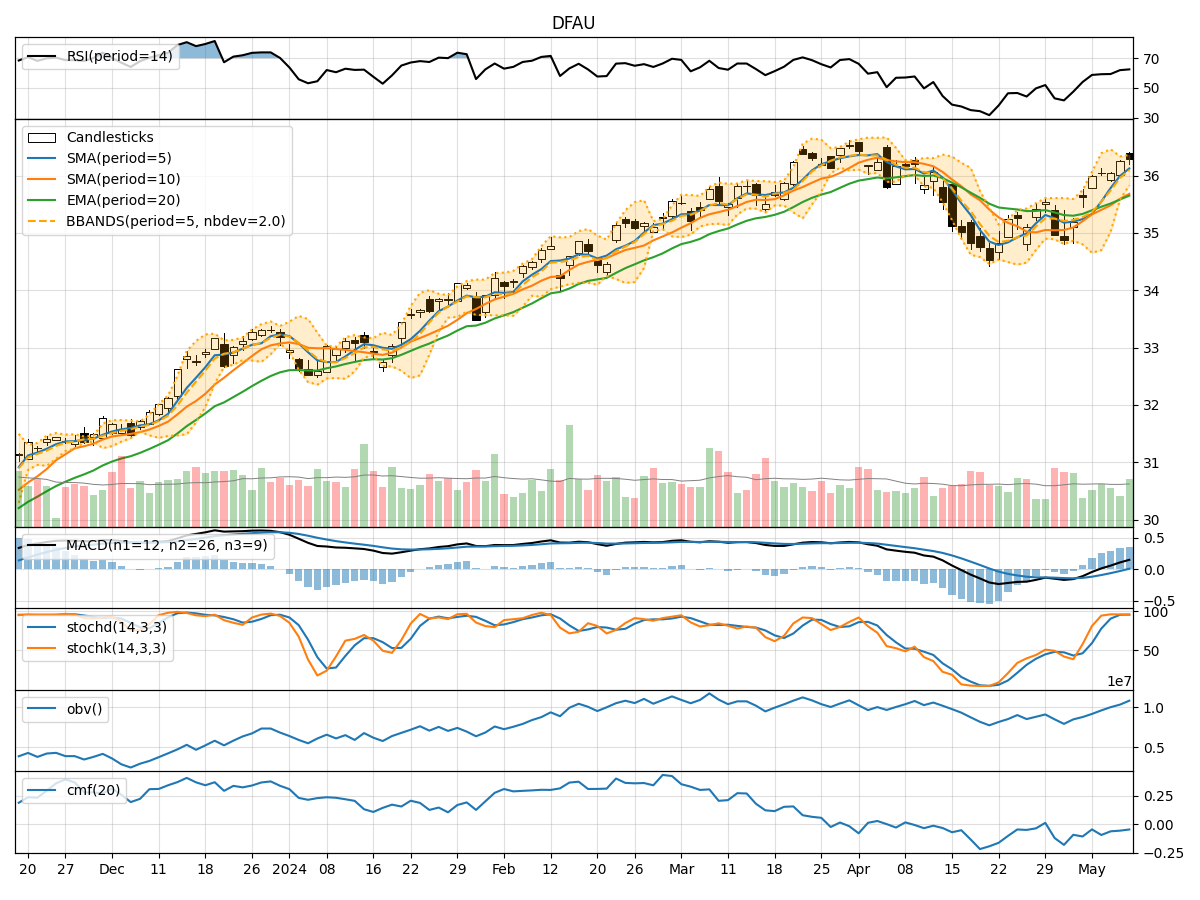
- Moving Averages (MA): The 5-day Moving Average (MA) has been consistently rising, indicating a bullish trend in the short term.
- MACD: The Moving Average Convergence Divergence (MACD) has shown positive values, suggesting upward momentum in the stock price.
- EMA: The Exponential Moving Average (EMA) has been trending upwards, supporting the bullish sentiment in the stock.
Momentum Analysis:
- RSI: The Relative Strength Index (RSI) has been increasing, reflecting strengthening momentum in the stock.
- Stochastic Oscillator: Both %K and %D values have been high, indicating strong buying pressure.
- Williams %R: The Williams %R is in the oversold territory, suggesting a potential reversal in the stock price.
Volatility Analysis:
- Bollinger Bands: The Bollinger Bands have been narrowing, indicating decreasing volatility in the stock.
- Bollinger %B: The %B indicator is above 0.8, suggesting the stock is trading near the upper band.
Volume Analysis:
- On-Balance Volume (OBV): The OBV has been steadily increasing, indicating accumulation by investors.
- Chaikin Money Flow (CMF): The CMF has been negative, suggesting some selling pressure in the stock.
Key Observations:
- The trend indicators point towards a bullish sentiment with rising moving averages and positive MACD values.
- Momentum indicators indicate strong buying pressure with increasing RSI and high Stochastic values.
- Volatility has been decreasing, potentially signaling a period of consolidation.
- Volume indicators show accumulation based on the rising OBV, despite some selling pressure indicated by the CMF.
Conclusion:
Based on the analysis of the technical indicators, the next few days for DFAU are likely to see a continuation of the bullish trend with strong buying pressure and decreasing volatility. Investors may consider buying opportunities in the stock, expecting further price appreciation. However, it is essential to monitor the indicators closely for any signs of reversal or increased selling pressure.