Technical Analysis of DFAX 2024-05-10
Overview:
In analyzing the technical indicators for DFAX over the last 5 days, we will delve into the trend, momentum, volatility, and volume indicators to provide a comprehensive outlook on the possible stock price movement in the coming days. By examining these key aspects, we aim to offer valuable insights and predictions to guide your investment decisions.
Trend Indicators:
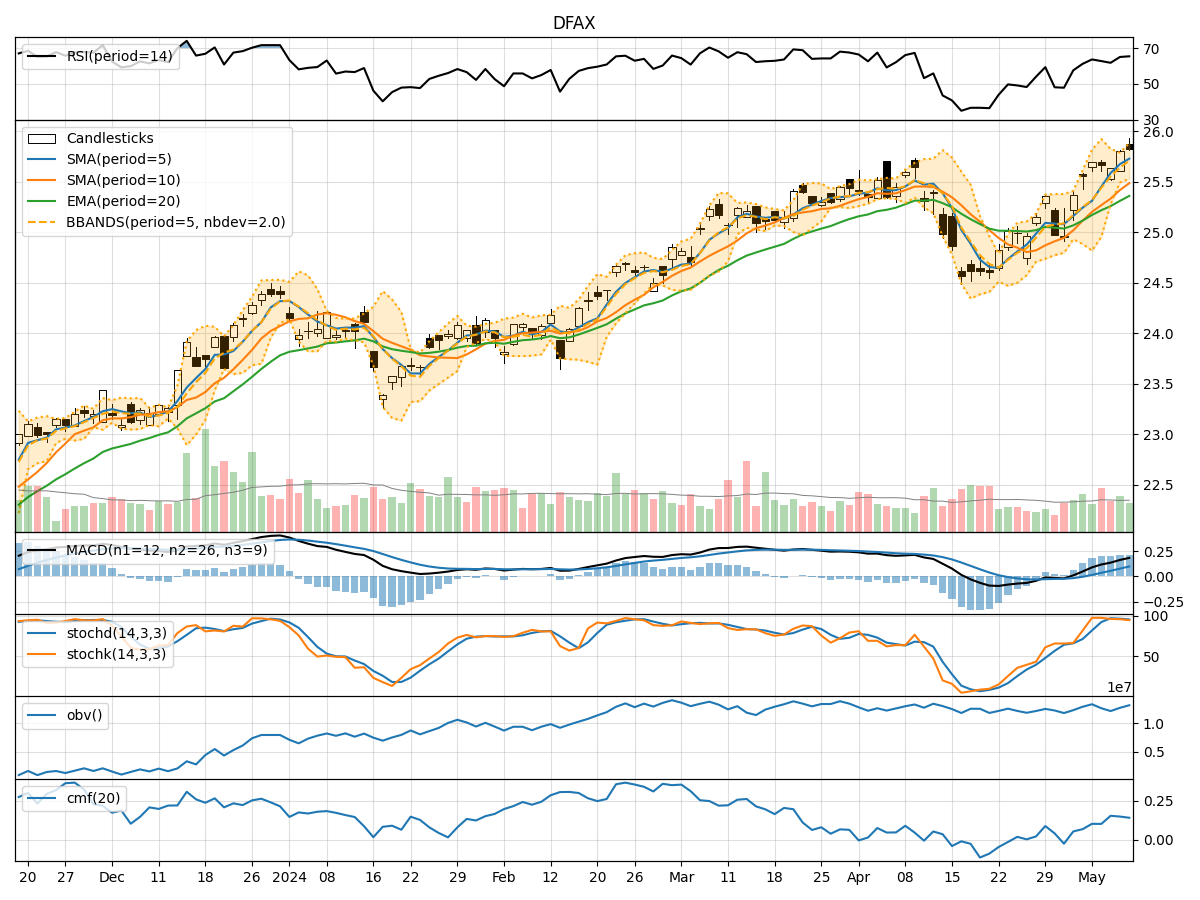
- Moving Averages (MA): The 5-day MA has been consistently above the 10-day SMA, indicating a short-term bullish trend. The EMA(20) has shown a gradual uptrend, suggesting positive momentum in the stock price.
- MACD: The MACD line has been above the signal line for the past 5 days, indicating bullish momentum. The MACD histogram has been steadily increasing, reflecting strengthening upward momentum.
Momentum Indicators:
- RSI: The RSI has been fluctuating around the overbought territory, indicating strong buying pressure. This suggests that the stock may be overvalued in the short term.
- Stochastic Oscillator: Both %K and %D lines have been in the overbought zone, signaling a potential reversal or consolidation in the stock price.
- Williams %R: The Williams %R has been consistently in the oversold territory, suggesting a possible reversal to the upside.
Volatility Indicators:
- Bollinger Bands: The stock price has been trading within the upper Bollinger Band, indicating an overbought condition. However, the bands have not shown significant expansion, suggesting a lack of volatility.
- Bollinger %B: The %B indicator has been hovering around 0.8, indicating that the stock is trading near the upper band. This could signal a potential pullback or consolidation.
Volume Indicators:
- On-Balance Volume (OBV): The OBV has shown a slight increase over the past 5 days, indicating accumulation by investors. This suggests underlying strength in the stock price.
- Chaikin Money Flow (CMF): The CMF has been positive over the last 5 days, indicating buying pressure. This aligns with the bullish momentum seen in other indicators.
Conclusion:
Based on the analysis of the technical indicators, the stock of DFAX is currently exhibiting overbought conditions in terms of momentum and volatility. The trend indicators suggest a bullish bias in the short term, supported by the positive MACD and moving averages. However, the momentum indicators, particularly the RSI and Stochastic Oscillator, indicate a potential reversal or consolidation in the stock price.
Considering the overall picture, it is advisable to exercise caution in the coming days. While the trend is bullish, the overbought conditions and potential reversal signals from momentum indicators suggest a possible pullback or sideways movement in the stock price. Traders may consider taking profits or implementing risk management strategies to navigate potential market corrections.
In conclusion, the next few days for DFAX could see a mixed outlook with a potential for consolidation or a mild correction in the stock price. It is essential to monitor key levels and indicators closely to make informed trading decisions.