Technical Analysis of DFCA 2024-05-10
Overview:
In analyzing the technical indicators for DFCA over the last 5 days, we will delve into the trend, momentum, volatility, and volume indicators to provide a comprehensive outlook on the possible stock price movement in the coming days. By examining these key aspects, we aim to offer valuable insights and predictions for potential investors.
Trend Indicators:
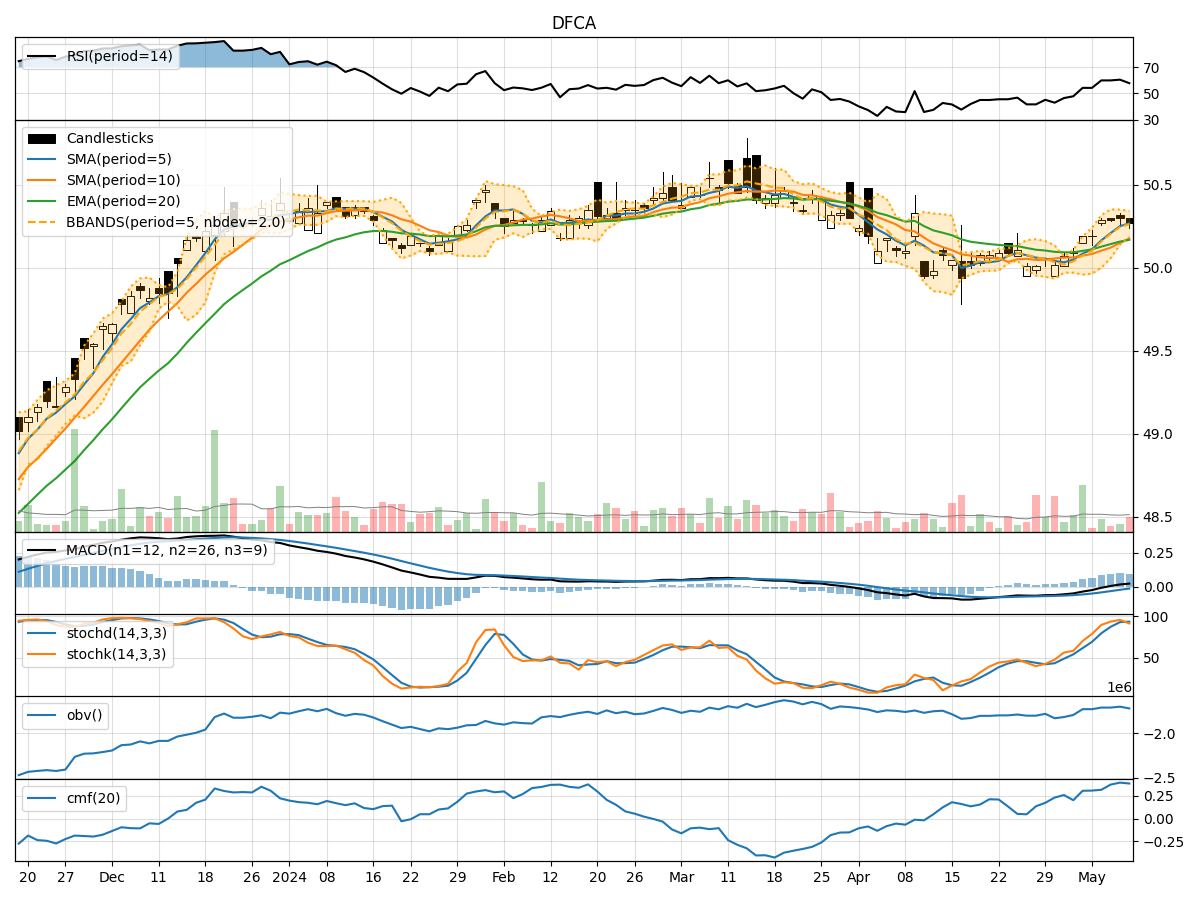
- Moving Averages (MA): The 5-day MA has been consistently above the 10-day SMA, indicating a short-term bullish trend. The EMA(20) has shown a slight upward trend, suggesting positive momentum.
- MACD: The MACD line has been above the signal line for the past few days, indicating a bullish signal. The MACD histogram has been increasing, further supporting the bullish momentum.
Momentum Indicators:
- RSI: The RSI has been in the overbought territory, indicating a strong bullish momentum. However, it is essential to note that an overbought RSI could signal a potential reversal.
- Stochastic Oscillator: Both %K and %D have been in the overbought zone, suggesting a strong bullish momentum. The %K line has been above the %D line, indicating continued upward pressure.
- Williams %R: The Williams %R has been in the oversold region, indicating a potential buying opportunity. However, it is crucial to consider other indicators for confirmation.
Volatility Indicators:
- Bollinger Bands (BB): The stock price has been trading within the upper Bollinger Band, indicating an overbought condition. The narrowing of the bands suggests a decrease in volatility.
- Bollinger %B: The %B indicator has been above 0.5, indicating an overbought condition. Traders should be cautious as this could signal a potential reversal.
Volume Indicators:
- On-Balance Volume (OBV): The OBV has shown mixed signals, with fluctuations in volume. This could indicate indecision among market participants.
- Chaikin Money Flow (CMF): The CMF has been positive, suggesting buying pressure. However, the rate of change in CMF should be monitored for potential shifts in momentum.
Conclusion:
Based on the analysis of the technical indicators, the stock of DFCA is currently exhibiting strong bullish momentum across various indicators. The trend indicators, momentum oscillators, and volatility indicators all point towards an upward trajectory in the stock price in the coming days. However, given the overbought conditions in some indicators like RSI and Williams %R, there might be a possibility of a short-term correction or consolidation before the uptrend resumes.
Investors should closely monitor the price action and key support/resistance levels to make informed trading decisions. Overall, the outlook for DFCA appears bullish in the near term, but caution is advised due to the potential for a temporary pullback.