Technical Analysis of DFE 2024-05-10
Overview:
In analyzing the technical indicators for the stock based on the last 5 days of data, we will delve into the trends, momentum, volatility, and volume indicators to provide insights into the possible future stock price movements. By examining these key aspects, we aim to offer a comprehensive analysis and make informed predictions for the upcoming days.
Trend Indicators:
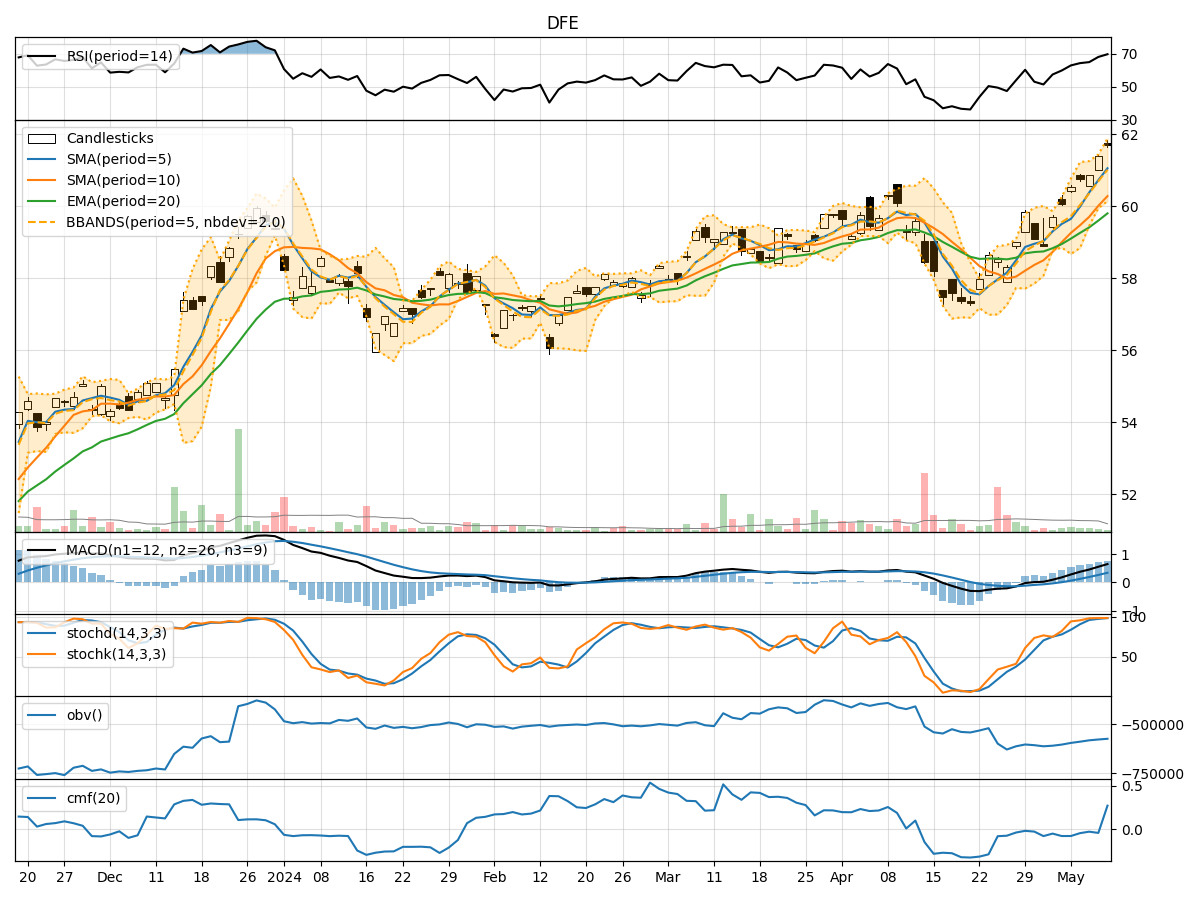
- Moving Averages (MA): The stock's closing prices have been consistently above the 5-day moving average, indicating a bullish trend.
- MACD (Moving Average Convergence Divergence): The MACD line has been above the signal line for the past 5 days, suggesting a bullish momentum.
- EMA (Exponential Moving Average): The EMA has been steadily increasing, supporting the bullish trend.
Momentum Indicators:
- RSI (Relative Strength Index): The RSI values have been consistently above 50, indicating bullish momentum.
- Stochastic Oscillator: Both %K and %D values have been in the overbought territory, signaling a strong bullish momentum.
- Williams %R (Willams Percentage Range): The stock has been in the oversold region, suggesting a potential reversal to the upside.
Volatility Indicators:
- Bollinger Bands: The stock price has been trading within the upper Bollinger Band, indicating high volatility and a potential continuation of the uptrend.
- Bollinger Band Width: The band width has been narrowing, suggesting a possible decrease in volatility and a period of consolidation.
Volume Indicators:
- On-Balance Volume (OBV): The OBV has been declining, indicating a decrease in buying pressure.
- Chaikin Money Flow (CMF): The CMF has been negative, suggesting a lack of buying interest in the stock.
Key Observations and Opinions:
- Trend: The stock is in a strong bullish trend based on moving averages and MACD.
- Momentum: Momentum indicators like RSI and Stochastic Oscillator signal a strong bullish sentiment.
- Volatility: Bollinger Bands show high volatility, but the narrowing band width indicates a potential consolidation phase.
- Volume: Declining OBV and negative CMF suggest weakening buying pressure.
Conclusion:
Based on the analysis of the technical indicators, the stock is likely to experience continued upward movement in the next few days. The bullish trend supported by moving averages and MACD, coupled with strong momentum indicators, indicates a favorable outlook for the stock price. However, the narrowing Bollinger Band width and declining volume indicators suggest a potential consolidation phase before further upside movement. Overall, the stock is poised for further bullish momentum in the near term.