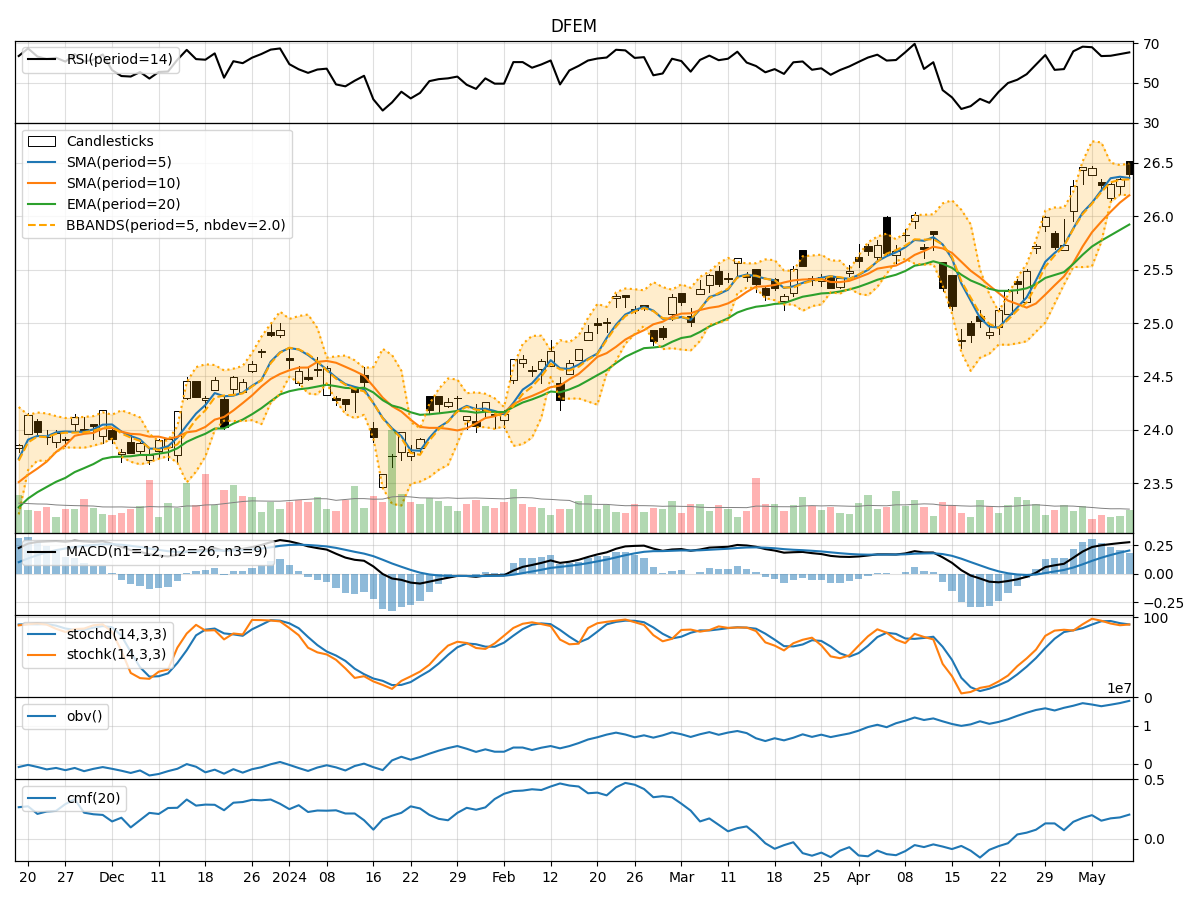
Technical Analysis of DFEM 2024-05-10
Overview:
In analyzing the technical indicators for DFEM over the last 5 days, we will delve into the trend, momentum, volatility, and volume indicators to provide a comprehensive outlook on the possible stock price movement. By examining these key aspects, we aim to offer valuable insights and predictions for the upcoming trading days.
Trend Indicators:
- Moving Averages (MA): The 5-day Moving Average (MA) has been consistently above the Simple Moving Average (SMA) and Exponential Moving Average (EMA), indicating a bullish trend.
- MACD: The MACD line has been consistently above the signal line, with both lines showing an upward trend, suggesting bullish momentum.
- MACD Histogram: The MACD Histogram has been increasing over the past 5 days, indicating strengthening bullish momentum.
Momentum Indicators:
- RSI: The Relative Strength Index (RSI) has been in the overbought territory but has shown a slight decrease, indicating a potential cooling off of the bullish momentum.
- Stochastic Oscillator: Both %K and %D lines of the Stochastic Oscillator have been in the overbought zone, suggesting a potential reversal or consolidation.
- Williams %R: The Williams %R has been in the oversold region, indicating a potential reversal to the upside.
Volatility Indicators:
- Bollinger Bands: The Bollinger Bands have been narrowing, indicating decreasing volatility and a possible period of consolidation.
- Bollinger %B: The %B indicator has been hovering around 0.5, suggesting a balanced market sentiment.
- Average True Range (ATR): The ATR has shown a decrease, indicating a potential decrease in price volatility.
Volume Indicators:
- On-Balance Volume (OBV): The OBV has been increasing over the past 5 days, indicating accumulation by investors.
- Chaikin Money Flow (CMF): The CMF has been positive, suggesting buying pressure in the market.
Key Observations and Opinions:
- Trend: The trend indicators suggest a strong bullish sentiment in the short term.
- Momentum: While momentum has been bullish, overbought conditions in RSI and Stochastic Oscillator indicate a potential reversal or consolidation.
- Volatility: Volatility has been decreasing, pointing towards a possible period of consolidation or a slowdown in price movements.
- Volume: Increasing OBV and positive CMF indicate buying interest in the stock.
Conclusion:
Based on the analysis of the technical indicators, the stock of DFEM is likely to experience a short-term consolidation or a potential reversal in the upcoming trading days. Traders should closely monitor key levels such as support and resistance to gauge the direction of the price movement. Exercise caution in trading decisions and consider implementing risk management strategies to navigate potential market fluctuations.